
Figure 2.
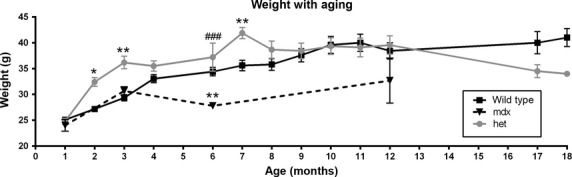
Change in weight over time in WT, mdx, and mdx:utrophin+/− (het) mice. Graph of weights (grams) of WT mice over an 18 month period, mdx mice for 12 months, and mdx:utrophin+/− (het) mice over an 18 month period. *Indicates significant difference from WT controls. #Indicates significant difference from mdx mice. One symbol is P < 0.05. Two symbols are P < 0.01. Three symbols are P < 0.001.