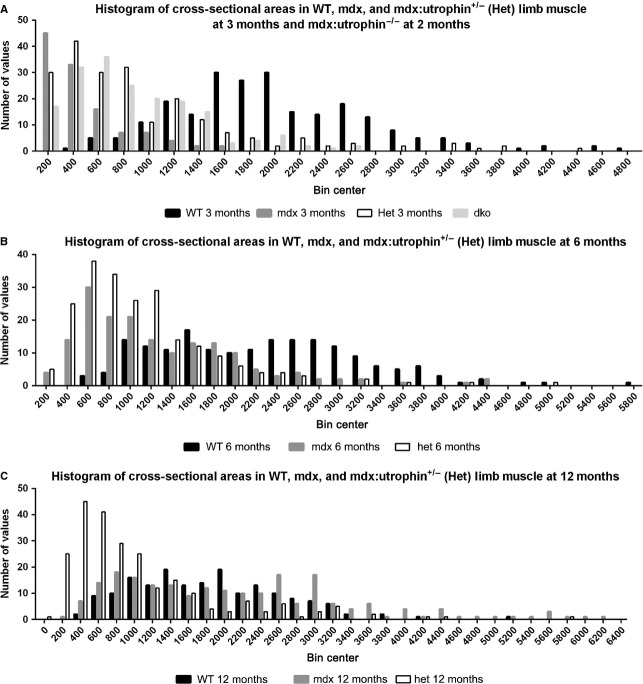
Figure 6.
Histogram of all cross-sectional areas of triceps muscles separated by fiber size in 200 μm2 bins. (A) Representative individual WT, mdx, mdx:utrophin+/− (het), and mdx:utrophin−/− dko limb muscles at 3 months. The dko muscles were examined from a 2-month-old mouse. Note that the myofibers from the dystrophic mouse muscles tended to cluster at the smaller mean cross-sectional areas, although certainly very large myofibers were also present. (B) Representative individual WT, mdx, and mdx:utrophin+/− (het) limb muscles at 6 months. Note that by 6 months the mdx profile had begun to resemble that of the WT mice, while the mdx:utrophin+/− (het) limb muscles still retained more fibers with smaller cross-sectional areas. (C) Representative individual WT, mdx, and mdx:utrophin+/− (het) limb muscles at 12 months. Note that even at 12 months, while the mdx myofiber areas completely overlapped those of the WT mouse, the mdx:utrophin+/− (het) limb muscle fibers still remained clustered at the smaller cross-sectional areas.

