
Figure 9.
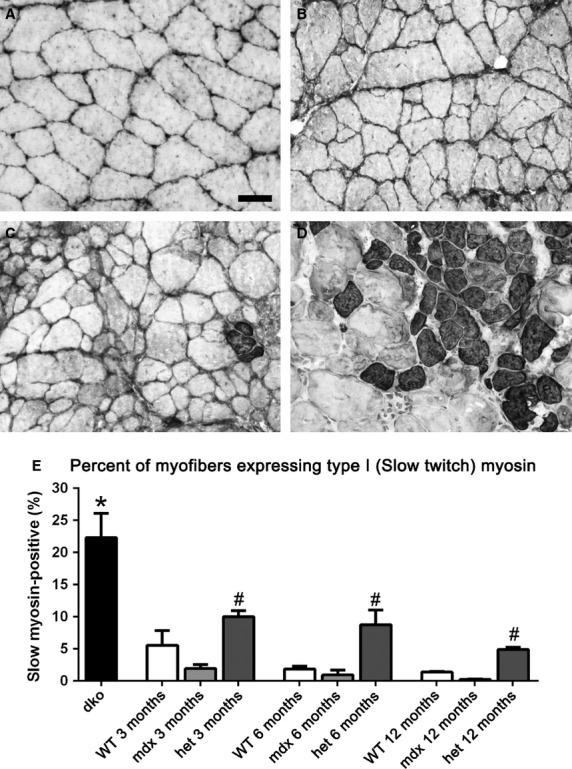
Morphometric analysis of type I slow twitch myofiber density in WT, mdx, mdx:utrophin+/− (het), and dko triceps muscles. Photomicrographs of (A) WT, (B) mdx, (C) mdx:utrophin+/− (het) all at 3 months of age, and (D) dko muscles at 2 months immunostained for type I MyHC expression. Bar is 50 μm. (E) Morphometric analysis of density of type I myofibers. *Indicates significant difference from 3 month WT. #Indicates significant difference between the age-matched mdx and mdx:utrophin+/− (het) muscle.