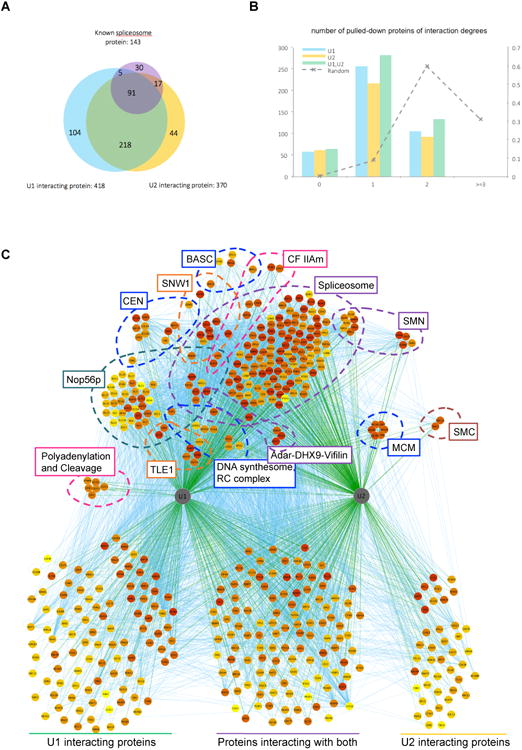
Figure 2. U1/U2 ChIRP-MS.

(A) Venn diagram of known spliceosome proteins, and proteins pulled-down by U1 or U2. The number of interactions in each set is given after the set label. (B) Numbers of U1/U2 pulled-down proteins by their degrees of separations from known spliceosome proteins. The dashed line represents the distribution of a randomly simulated set of the same number of proteins pulled-down by U1 and U2 (right axis). (C) Protein-protein and protein-RNA interaction network of U1/U2 pulled-down proteins. Proteins belonging to known complexes are organized and annotated in groups in top half of the plot, and proteins of unknown affiliation are presented at the bottom. Complexes and proteins more strongly enriched by U1 (left in graph) (e.g. Polyadenylation and cleavage, Nop56p) are positioned accordingly.
