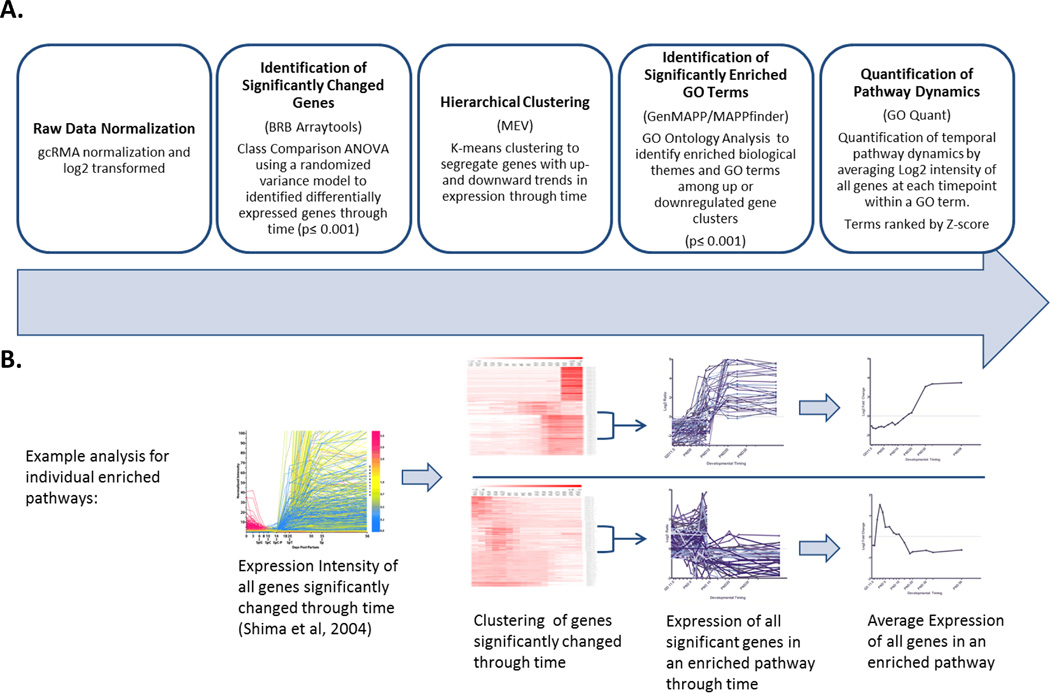
Figure 1. Microarray Analysis Pipeline for Quantification of Pathway Dynamics.

A) Summary of analysis pipeline B) Illustration of data analysis process. Starting with single gene expression in testis through time (Shima et al, 2004) we normalized data and identified significantly changed genes using BRB Arraytools software, clustered genes with significantly increasing or decreasing expression through time using Multiple Experiment Viewer software (MEV), then used GO Quant software to identify GO terms enriched among these clusters and average the expression of all significantly changed genes in that pathway to produce a quantitative summary of gene expression dynamics in each GO term through time.
