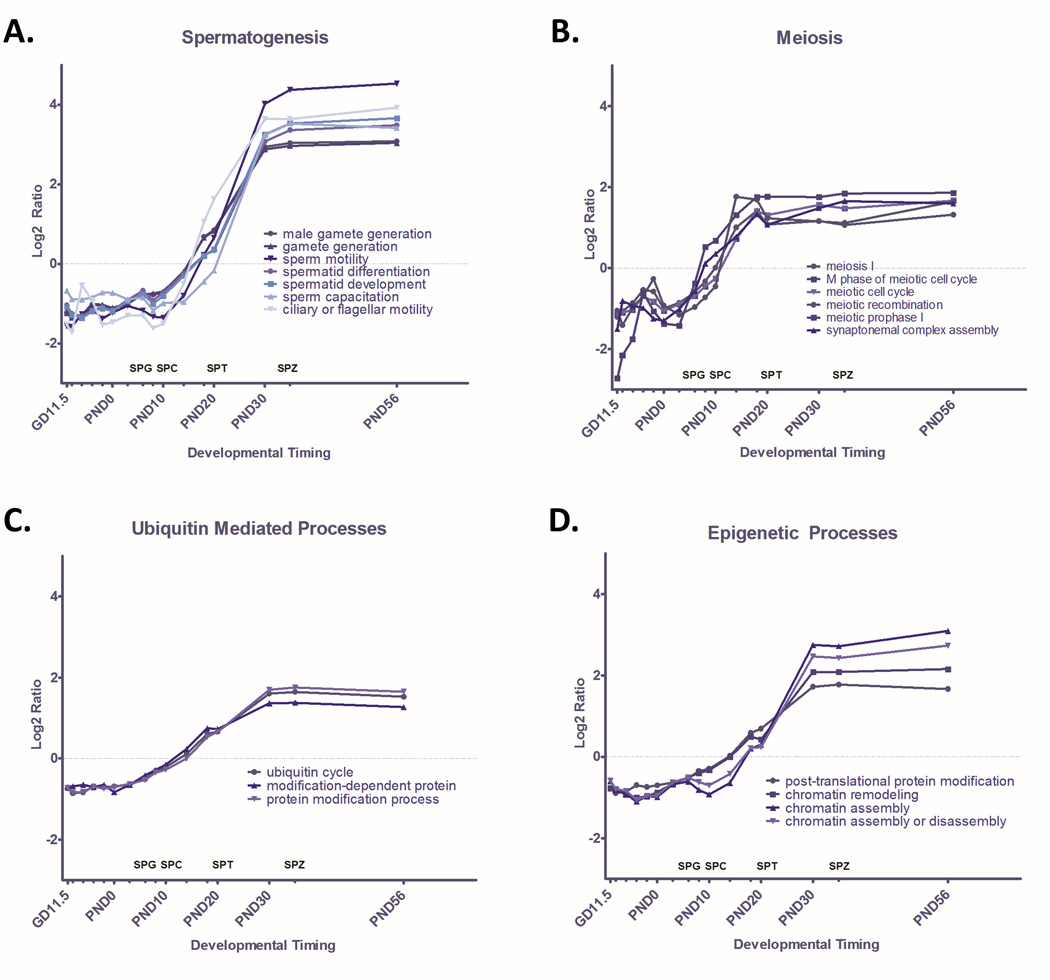
Figure 2. Quantified Pathway Dynamics of GO Terms that Significantly Increase Through Time.

GO terms enriched among genes with significantly increasing expression (p<0.001) through time were identified through MAPPfinder. Significantly enriched GO terms (p<0.001) were ranked by Z-score and dominant themes among these terms were identified as A) Spermatogenesis, B) Meiosis, C) Ubiquitin Mediated Processes, and D) Epigenetic Processes. Dynamic change in GO terms related to each dominant theme are plotted here as the ratio of average Log2 intensity of expression of all significantly changed genes at each timepoint in a GO term over Average Log2 intensity across all timepoints for that GO term. Corresponding stages of spermatogenesis, including spermatogonia (SPG), spermatocyte (SPC), spermatid (SPT), and spermatozoa (SPZ) are indicated along the X axis.
