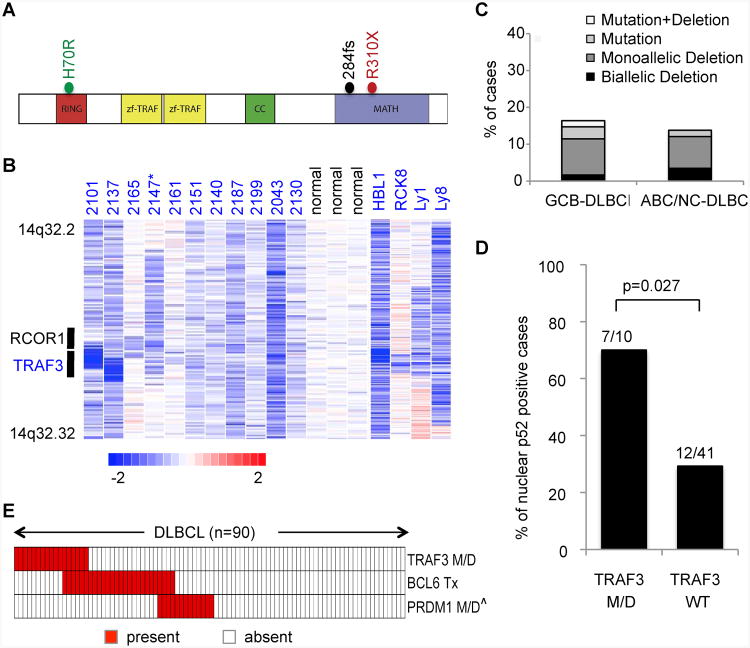
Figure 1. Recurrent TRAF3 and BCL6 Lesions in DLBCL.
(A) Diagram of the TRAF3 protein, with its relevant functional domains. The mutations found in DLBCL are indicated.
(B) Inferred log2 copy number (CN) data from representative DLBCL cases carrying deletions encompassing TRAF3, compared to normal controls. The position of TRAF3 and its neighboring gene RCOR1 is indicated. In the red-blue scale, white corresponds to a normal (diploid) CN log-ratio, blue is deletion and red is gain. *Case 2147 harbored a point mutation in the residual allele, leading to biallelic inactivation.
(C) Overall frequency of TRAF3 genetic lesions (point mutations and deletions) in DLBCL phenotypic subtypes. 47 GCB and 51 ABC/NC-DLBCL biopsies, 14 GCB and 7 ABC-DLBCL cell lines were included in this analysis (the primary tumors and cell lines of each DLBCL subtype displayed similar frequencies of TRAF3 lesions). Note that among the 119 samples, 29 lack copy number data, thus the frequencies shown may represent an underestimate.
(D) Percentage of DLBCL primary cases showing nuclear p52 staining, as a readout of non-canonical NF-κB activation, in TRAF3 M/D versus TRAF3 WT cases. The cutoff used to score cases as nuclear positive was ≥ 20% (Compagno et al., 2009).
(E) Relative distribution of genetic lesions affecting TRAF3, BCL6 and PRDM1 in individual DLBCLs. Each column represents one patient, with color codes indicating the presence or absence of the corresponding feature (Tx, translocation; M/D, mutations and/or deletions). Only the 90 samples with full information on TRAF3 M/D, BCL6 Tx, and PRDM1 M/D are included. ˆPRDM1 genetic lesions only include biallelic deletions or point mutations, since the functional significance of large 6q monoallelic deletions is unclear. Details of PRDM1 and BCL6 lesions have been described previously (Mandelbaum et al., 2010; Pasqualucci et al., 2006).
See also Figure S1.

