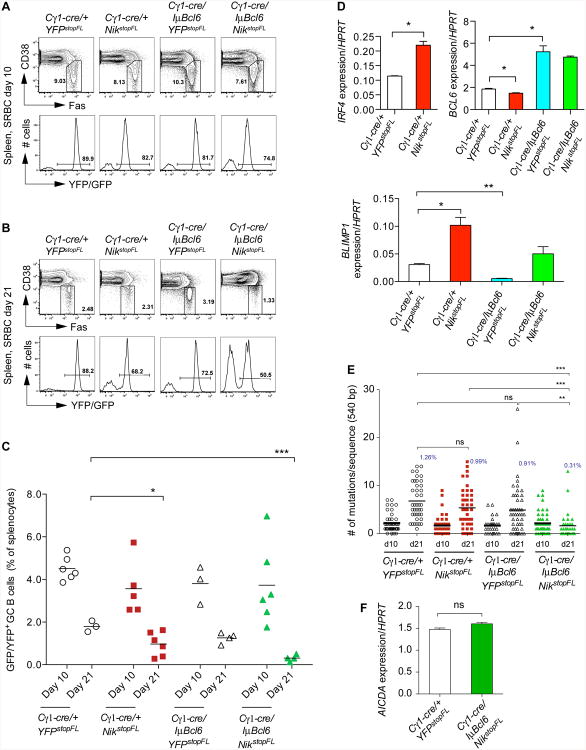
Figure 2. Impact of Constitutive NIK and BCL6 Expression on the GC Reaction.
(A and B) Representative FACS analysis of splenic GC B cells at day 10 (A) and day 21 (B) after primary immunization with SRBCs, respectively. Upper panels show the GC B cell population (within the gate; CD19+FashiCD38lo). Lower panels show reporter expression in GC B cells.
(C) Summary of FACS analysis of GC B cells as in (A) and (B). Black bar represents mean for each genotype of mice at the indicated time points.
(D) Real-time PCR analysis of the expression levels of the indicated genes in reporter-positive GC B cells at day 10 after primary immunization with SRBCs. Values represent normalized levels to HPRT. Data are represented as mean ± standard error of the mean (SEM).
(E) IgH somatic mutation in reporter-positive GC B cells at day 10 (13-16 sequences per mouse from 2-3 mice per genotype) and day 21 (12-16 sequences per mouse from 2-3 mice per genotype) after primary immunization with SRBCs. Black bar represents mean. Average mutation frequency at day 21 is shown in graph.
(F) Real-time PCR analysis of AICDA transcript levels in reporter-positive GC B cells at day 10 after primary immunization with SRBCs. Values represent normalized levels to HPRT. Data are represented as mean ± SEM.

