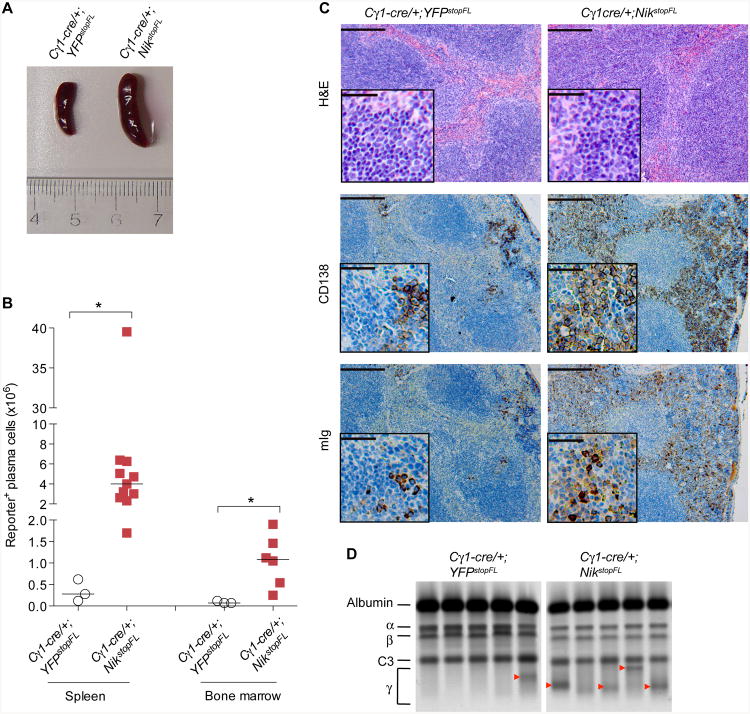
Figure 6. Plasma Cell Hyperplasia in Mice with Constitutive Alternative NF-κB Signaling.
(A) Representative picture of spleens from aged mice (≥ 60 weeks) of the indicated genotypes. Three or more mice per genotype were analyzed.
(B) Number of reporter-positive plasma cells (B220loCD138+) in spleen and bone marrow of aged mice of the indicated genotypes. Black bar represents median. The statistics was analyzed using unpaired, nonparametric Mann-Whitney test (comparing ranks).
(C) Representative histological (H&E) and immunohistochemical (CD138 and Ig) staining of spleens from aged mice of the indicated genotypes. Three or more mice per genotype were analyzed. Scale bar, 1000 μm; inset, 200 μm.
(D) Serum protein electrophoresis of representative samples from aged mice of the indicated genotypes. The position of albumin and of various globulin components of the serum is indicated. Red arrowhead indicates M-spike. In total, 3/9 (33%) of Cγ1-cre/+YFPstopFL mice and 8/9 (89%) of Cγ1-cre//+YFPstopFL mice display M-spike, respectively.
See also Figure S3.

