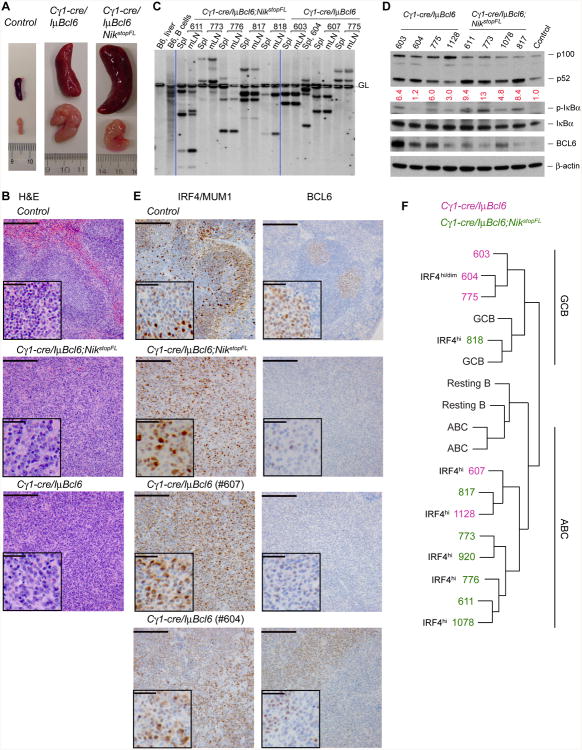
Figure 7. Constitutive Alternative NF-κB Activation Synergizes with BCL6 in DLBCL Formation and Progression.
(A) Representative pictures of spleens and mesenteric lymph nodes from mice of the indicated genotypes.
(B) Representative H&E staining of spleens from compound mutant and control mice. Scale bar, 1000 μm; inset, 200 μm. See a summary of histological findings in table S1.
(C) Southern blot analysis of tumor clonality using a JH4 probe. Dashed line, germline IgH configuration. Spl, spleen; mLN, mesenteric lymph node. Clonal tumors usually exhibit two non-germline bands corresponding to VDJ and DJ rearrangements in IgH alleles.
(D) Immunoblot analysis of various proteins in tumor tissues from the indicated compound mutant mice or in normal spleen from a Cγ1-cre/+ mouse. Tumor tissues, spleens of tumor-bearing mice (only those containing ∼50% of lymphoma B cells, as determined by FACS analysis, were selected for this assay). β-actin serves as loading control.
(E) Representative immunohistochemical (IHC) staining for IRF4/MUM1 and BCL6 on spleen sections of lymphoma-bearing compound mutants and an SRBC-immunized control mouse. Scale bar, 1000 μm; inset, 200 μm. Note that BCL6 expression from the transgene is lower than that from the endogenous loci of normal GC B cells (Cattoretti et al., 2005); two Cγ1-cre/IμBcl6 tumors are shown, and tumor #604 shows at least two populations, one of which shows relatively low IRF4 staining and high BCL6 (IRF4dimBCL6hi) while the other exhibits higher IRF4 and lower BCL6 staining (IRF4hiBCL6dim). See the summary of IHC results in table S1.
(F) Comparison of gene expression profiles of the indicated mouse tumors to that of GC B cells (GCB), resting B cells (Resting B), or activated B cells (ABC). The protein levels of IRF4 detected by IHC staining are noted next to the corresponding tumors [see also (E) and table S1], which complement gene expression profiling in classification of DLBCL subtypes.
See also Figure S4 and Tables S1-S3.

