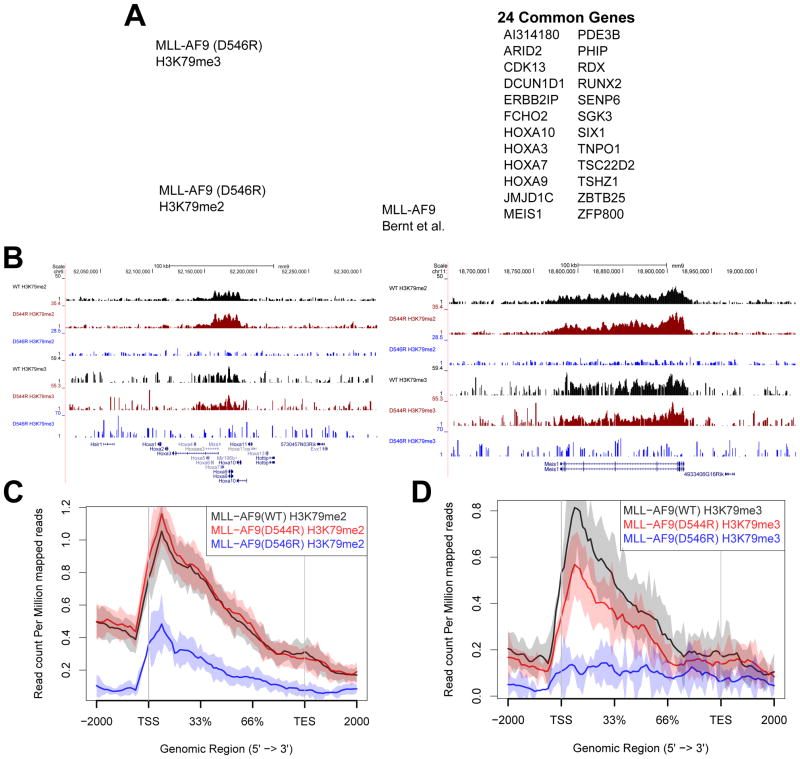
Figure 5. MLL-AF9 (D544R) and MLL-AF9 (D546R) display distinct patterns of loss of H3K79me2 and H3K79me3 on a select set of genes.
A) Venn diagram overlaying gene sets showing significant loss of H3K79me2 and H3K79me3 marks upon comparison of MLL-AF9 (D546R) with MLL-AF9 (WT) (FDR < 0.1). Additionally overlaid is the set of genes identified previously by ChIP-Seq as direct MLL-AF9 targets (Bernt et al., 2011). Listed to the right are genes that overlap between the H3K79me2, H3K79me3, and MLL-AF9 direct target datasets. B) Chip-seq profiles of the HOXA cluster and Meis1 both show a loss in the H3K79me2 and H3K79me3 marks with the D546R mutation. C) H3K79me2 genomic profile at genes we identified to be significant in Figure 5A shows that MLL-AF9 (D546R) significantly reduces H3K79me2 marks whereas there is no difference in the profile between MLL-AF9 (D544R) and MLL-AF9 (WT). D) H3K79me3 genomic profile at genes we identified to be significant in Figure 5A shows that MLL-AF9 (D546R) reduces H3K79me3 to background levels, even lower than observed for the H3K79me2 profile of this same mutant. There is also a significant difference in MLL-AF9 (D544R) and MLL-AF9 (WT) profiles (Wilcoxon test p value = 0.02).

