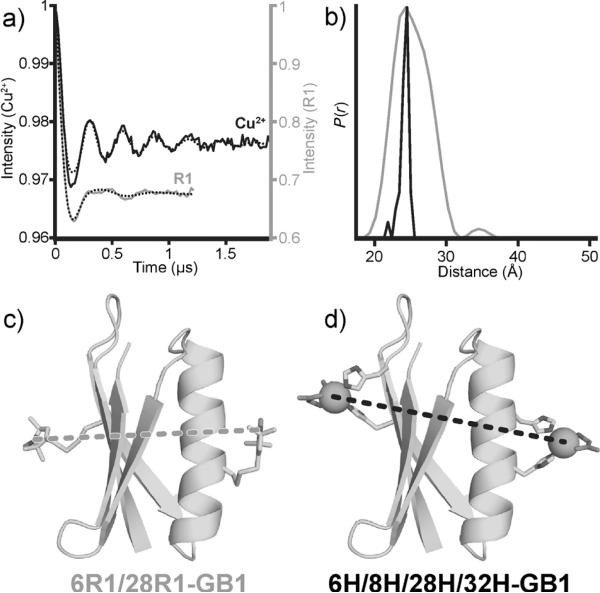
Figure 3.
a) Baseline-subtracted time-domain DEER data for both the R1 (gray) and the Cu2+ samples (black) as well as the best fit (dotted black lines) from Tikhonov regularization; modulation depths have been scaled for comparison. b) The distance distributions for each sample. c,d) Structural models of 6R1/28R1-GB1 and 6H/8H/28H/32H-GB1 complexed with Cu2+–IDA with measured interspin distances.

