Figure 1.

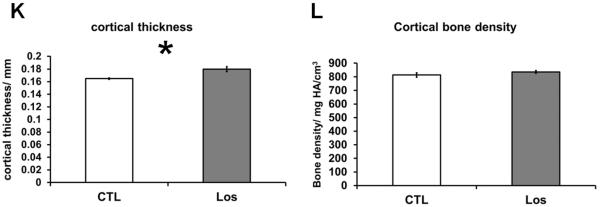
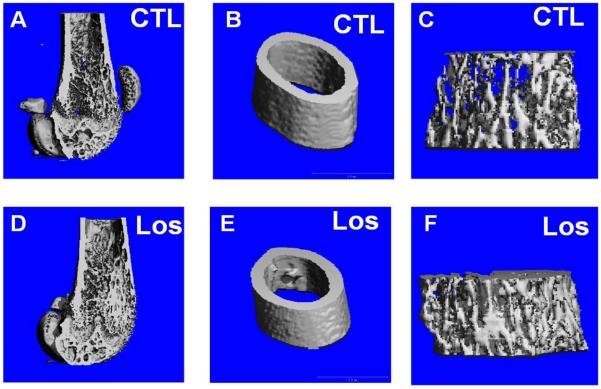
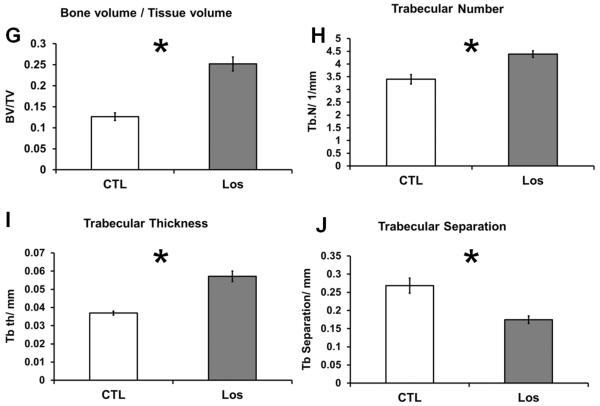
MicroCT reconstruction shows an increased trabecular bone mass and cortical thickness in Losartan treated mice. MicroCT reconstruction of the distal femur (A and D), cortical bone (B and E) and trabecular bone(C and F). (G–J) Trabecular bone indices quantified by microCT. Bone volume/Tissue volume (BV/TV) (G), Trabecular number (Tb.N) (H), Trabecular thickness (Tb.Th) (I) are improved in the treated group. Trabecular separation (Tb.Sp) (J) is decreased in the treated group. (K–L) Cortical bone indices obtained from microCT. The cortical thickness (Ct.Th) (K) is increased by 9% but not bone mineral density (BMD) in Losartan treated group. CTL: control, Los: Losartan-treated, * p<0.05, CTL: n = 7, LOS: n=8.


