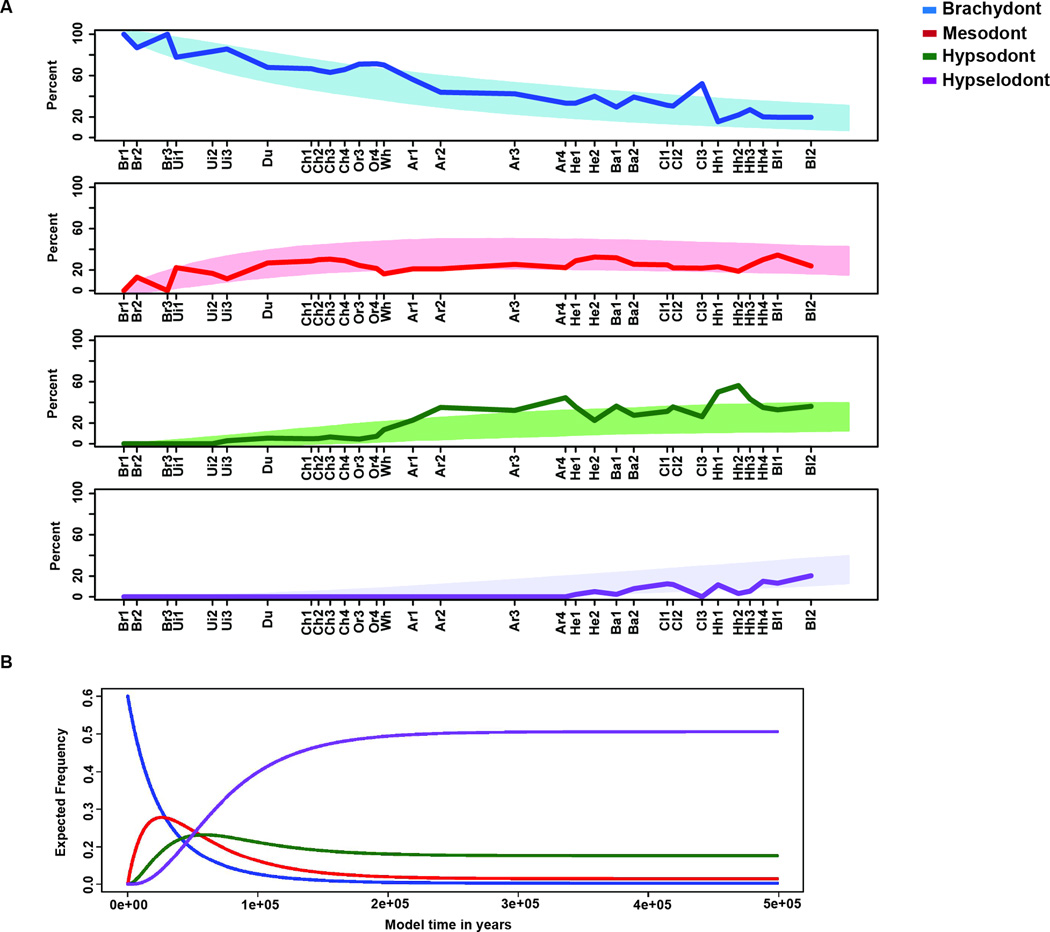
Figure 4. Markov model simulation confidence interval overlay and future predictions.
(A) Percent of the 100 simulated taxa that occur in each state. Blue represents brachydont (top), red represents mesodont (second), green represents hypsodont (third), and purple represents hypselodont (bottom). Shaded area represents the 99% Confidence Interval (CI) calculated from model simulation and dark solid lines are the observed frequencies from the fossil record converted to percent for comparison. The corresponding North American Land Mammal Ages (NALMA) are described in Table S4. (B) Expected frequency of states given the Markov two-parameter model. Model time is extended to show steady state near 250 million years of model time. The blue represents the brachydont state, the red represents the mesodont state, the green represents the hypsodont state, and the purple represents the hypselodont state.

