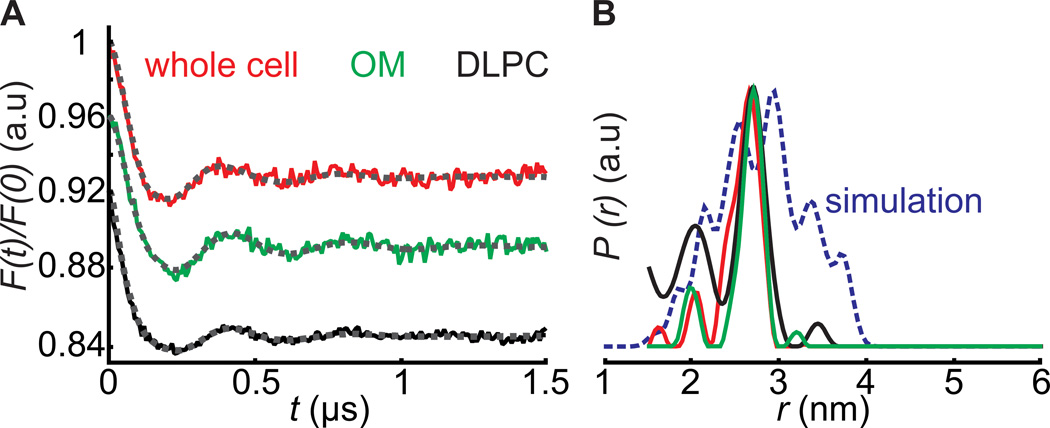
Figure 3.
PELDOR between BtuB188R1 and TEMPO-CNCbl spin pairs in whole cells, OM and DLPC vesicles. The whole cells or outer membrane preparations contained 25–30 µM BtuB after MTSSL labeling, and PELDOR was performed after adding an equal amount of TEMPO-CNCbl. A) Normalized form factors obtained after intermolecular background correction of the primary data (Figure S6 C-E) using a 3D spin distribution with the fittings overlaid in dotted grey lines. B) Distance distributions calculated with the DeerAnalysis2013[25] software with the Tikhonov regularization parameter α set to 10. In DLPC, the modulation amplitude obtained is not directly comparable to the other samples due to the bidirectional orientation and unknown concentration of BtuB. Even with a large fraction of non-specific labeling (Table S1) the OM sample gave ~8% modulation amplitude. Although devoid of non-specific signals, whole cell samples as well gave similar modulation amplitudes, which might be due to the transport of a fraction of TEMPO-CNCbl into the periplasm. The blue line shows the MMM simulation[24] (www.epr.ethz.ch/software/index) for PELDOR between 188R1 and TEMPO-CNCbl on PDB 1NQH.

