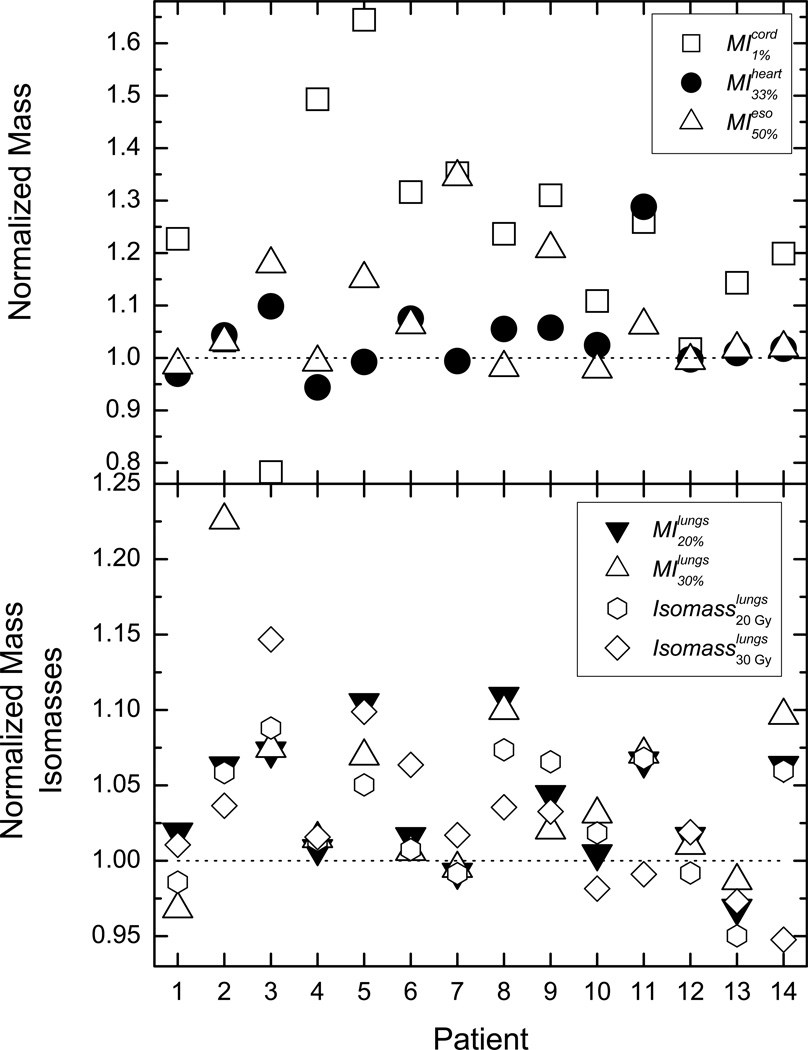
Figure 2.
The presented data is the same as in Figure 1, but in this case the dose data has been extracted from the dose-mass histograms. In the top panel are the normalized doses to 1% mass of the spinal cord, 33% of the heart mass, and 50% of the esophagus mass. In the bottom panel the presented data is for doses to 20% and 30% of lung mass, as well as the lung tissue mass receiving 2000 and 3000 cGy.

