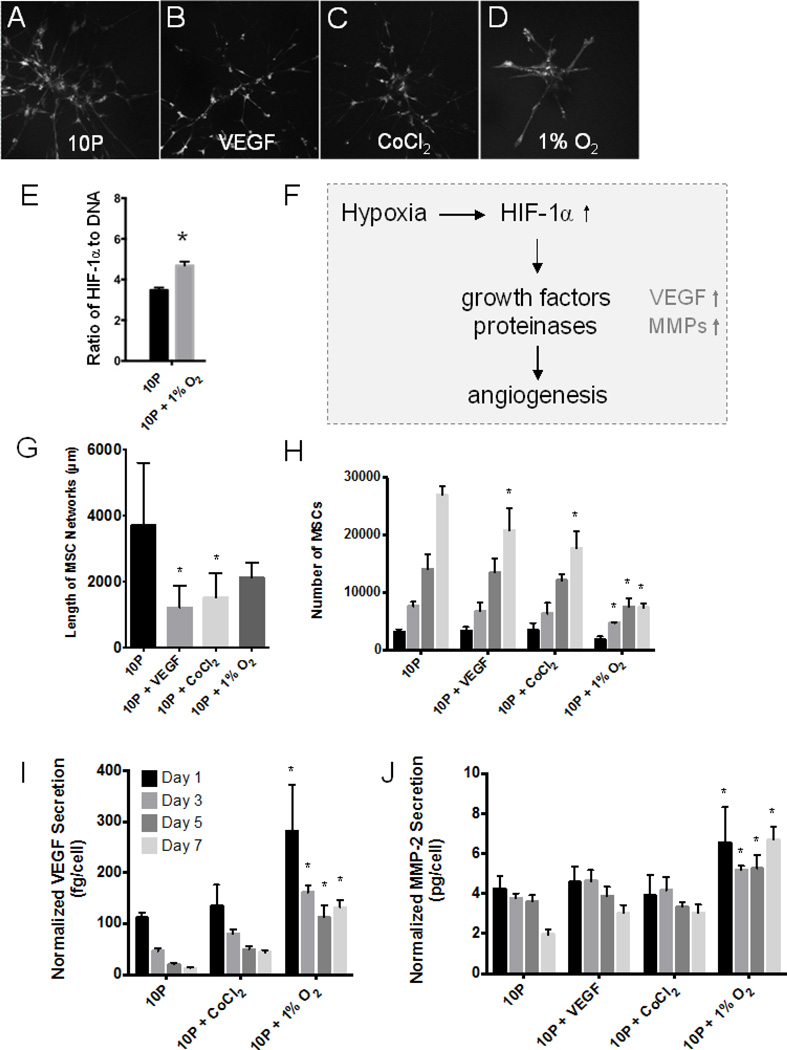
Fig. 4.
VEGF and hypoxia stimuli study. Abbreviations: 10P, 10mg/mL PEGylated fibrin. (A–D) Fluorescent z-stack projections representative of morphological outcomes in (G). (E) HIF-1α production quantified by ELISA and normalized to total DNA content by nanodrop. (F) General mechanism of hypoxia-induced neovascularization, linking hypoxia with increased VEGF and MMP-2 production. (G) Average network lengths per microcarrier bead as measured by our 3D quantification method. (H) Results of Celltiter 96 assay indicated no mitogenic response to VEGF or CoCl2 but a significant decline in MSC proliferation under 1% O2. Hypoxic stress increased VEGF secretion (I) and MMP-2 production (J) of MSCs in PEGylated fibrin; values are normalized to cell numbers reported in (F). *p < 0.05, versus 10P control at same time point

