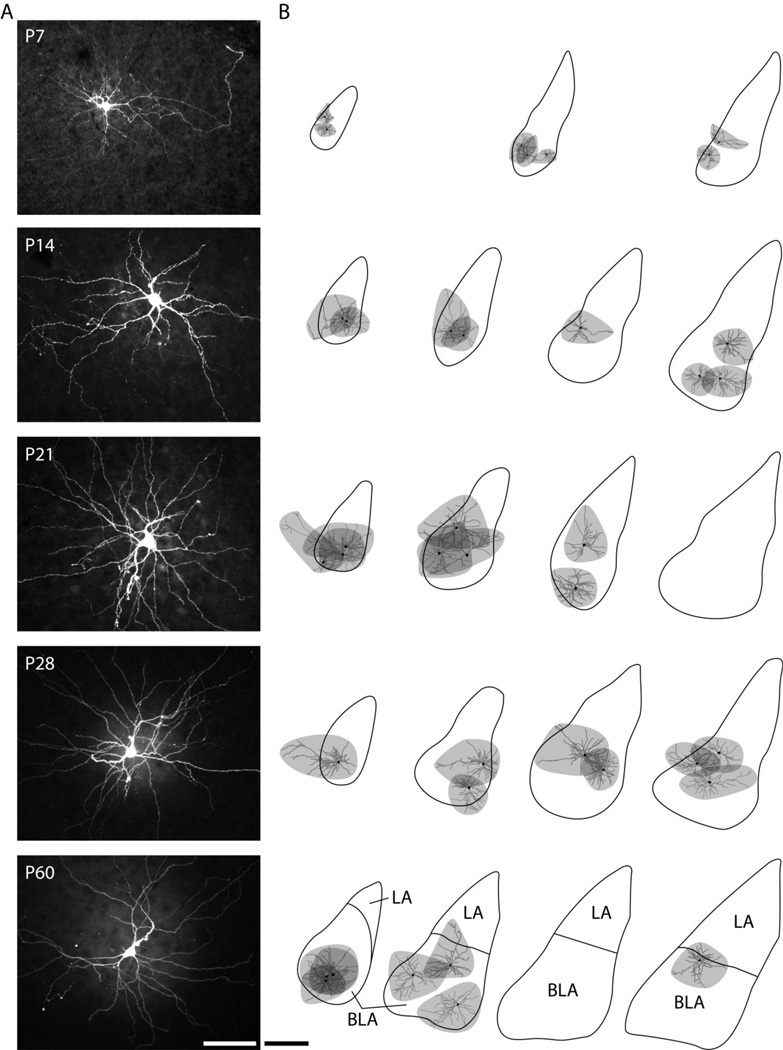
Figure 3.
Location of reconstructed BLA principal neurons. (A) Representative photomicrographs of filled neurons at each time point were produced from maximum projections of z-stack images through entire recording slices. Scale bar represents 100 µm. (B) Approximate locations and dendritic arborization of filled BLA neurons at each time point are depicted on outlines of the basolateral complex from representative coronal sections. Soma and dendrites of reconstructed neurons (from slices of 300–350 µm thickness) are illustrated in black and gray, respectively, while the area covered by the dendritic arbor is shaded in gray. Outlines of the basolateral complex were drawn from every sixth section of 90 µm (P7) or 60 µm thickness (P14–P28). Outlines of the BLA and the lateral nucleus (LA) at P60 correspond to Bregma coordinates −2.30 mm, −2.80 mm, −3.14 mm, and −3.30 mm (Paxinos and Watson, 1997). Scale bar represents 500 µm.

