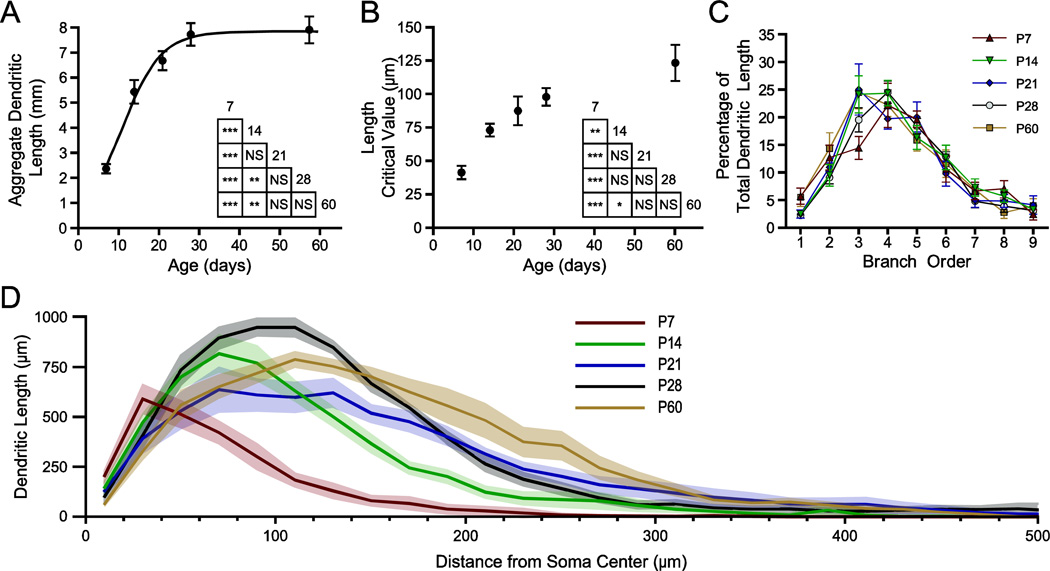
Figure 6.
Dendritic arbors expand with a specific pattern across postnatal development. Sholl analysis was performed on reconstructed neurons with 20 µm steps between rings. (A, B) Aggregate length (A) and the critical value for length (B) of the dendritic arbor are plotted versus age as mean ± SEM, with a best-fit sigmoidal Boltzmann curve. The results of Tukey’s tests following two-way ANOVA are depicted in inset grids (* P < 0.05; ** P < 0.01; *** P < 0.001; NS: not significant; n = 8 per time-point). (C) Percentage of total dendritic length found in branches of a given order is plotted as mean ± SEM for each age (n = 8 neurons per age). (D) The profile of dendritic length derived from the Sholl analysis is plotted as mean (black line) and SEM (grey band) versus distance from the center of the soma, illustrating the expansion and pruning of the dendritic arbor with age (n = 8).

