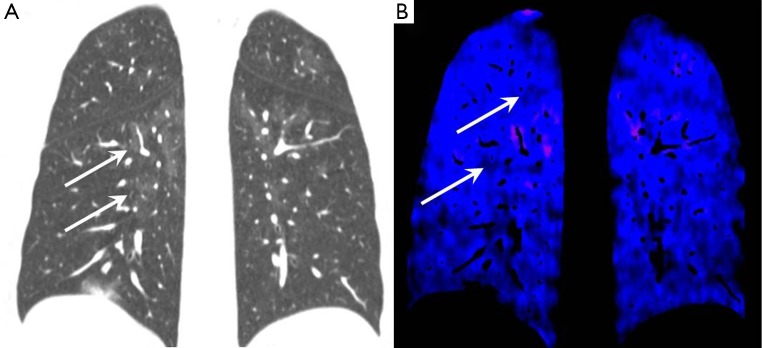
Figure 7.

Idiopathic pulmonary arterial hypertension. (A) Coronal lung windows CT image showing multiple subtle ill-defined ground glass opacities throughout both lungs (arrows); (B) coronal dual energy iodine perfusion map showing regions of hypoperfusion corresponding to the nodular areas (arrows). CT, computed tomography.
