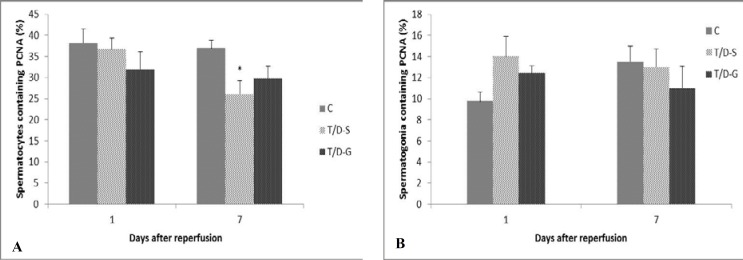
Figure 3.
Percentages of spermatocytes (A) and spermatogonia (B) containing PCNA in all experimental groups calculated at 1 and 7 days after reperfusion. Bars represent mean±SEM. Comparison among groups was made using one-way ANOVA followed Tukey’s post hoc test. All means marked with * (p<0.05) significantly differ from control group.

