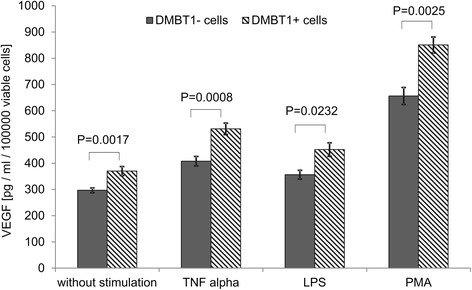
Figure 3.

VEGF levels in unstimulated and stimulated DMBT1+ and DMBT1- cells. VEGF levels were determined in cell culture supernatants by ELISA. DMBT1+ cells showed significantly elevated VEGF levels in the basal state without stimulation as well as after stimulation with TNFα, LPS, or PMA. The VEGF mean values of the cell culture wells are shown for different stimulations and separately for DMBT1+ and DMBT1- cells. Error bars represent standard error of the mean. Sample sizes of the eight resulting subgroups were between 5 and 14. The p values were derived from 2 sample t-tests which have been used to compare the VEGF mean values for DMBT1+ and DMBT1- cells.
