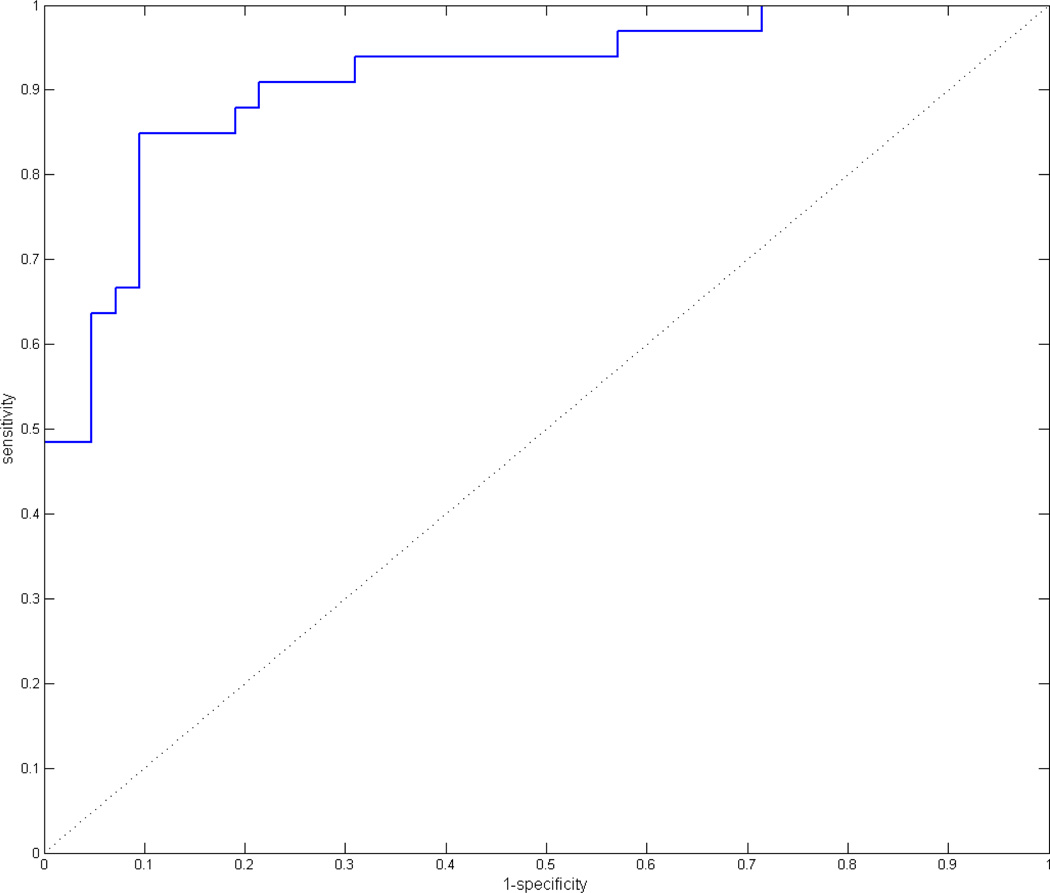
Figure 4. Patient ROC analysis.
ROC analysis for combined data from ACA, inferior MCA, and superior MCA territories in stroke patients. An asymmetry index threshold was used to discriminate normally perfused from hypoperfused regions, and the threshold was varied from 0 to 1 to generate the ROC curve.

