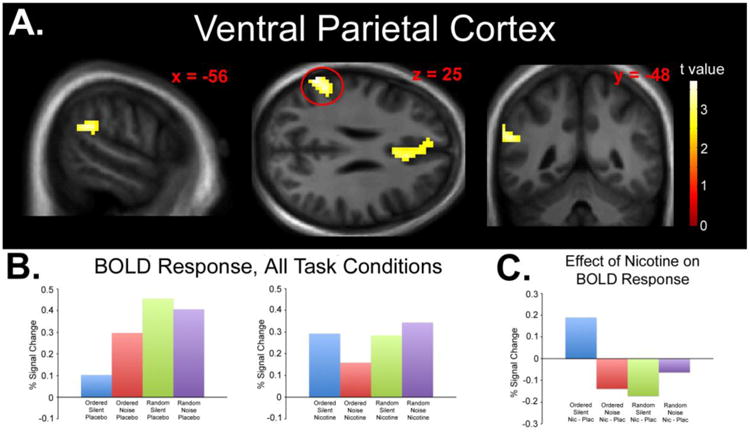
Fig. 2.

A) Statistical parametric map displaying a significant drug × difficulty × distraction interaction effect in the left VPC. Map thresholded at p < 0.01, cluster size 62 voxels. Images are displayed in the neurologic convention (R on R). B) Plotted peak BOLD responses (% signal changes) for each experimental condition (relative to fixation baseline). C) Plotted peak BOLD responses (% signal changes) for each condition collapsed across the effect of nicotine (Nicotine > Placebo) displaying the nature of the significant interaction.
