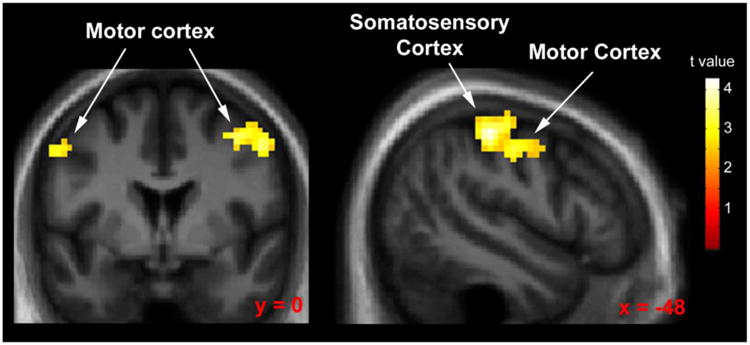
Fig 4.

Statistical parametric map displaying areas of significantly increased response during nicotine administration (relative to placebo) collapsed across all other task conditions. Map thresholded at p < 0.01, cluster size 62 voxels. Images are displayed in the neurologic convention (R on R).
