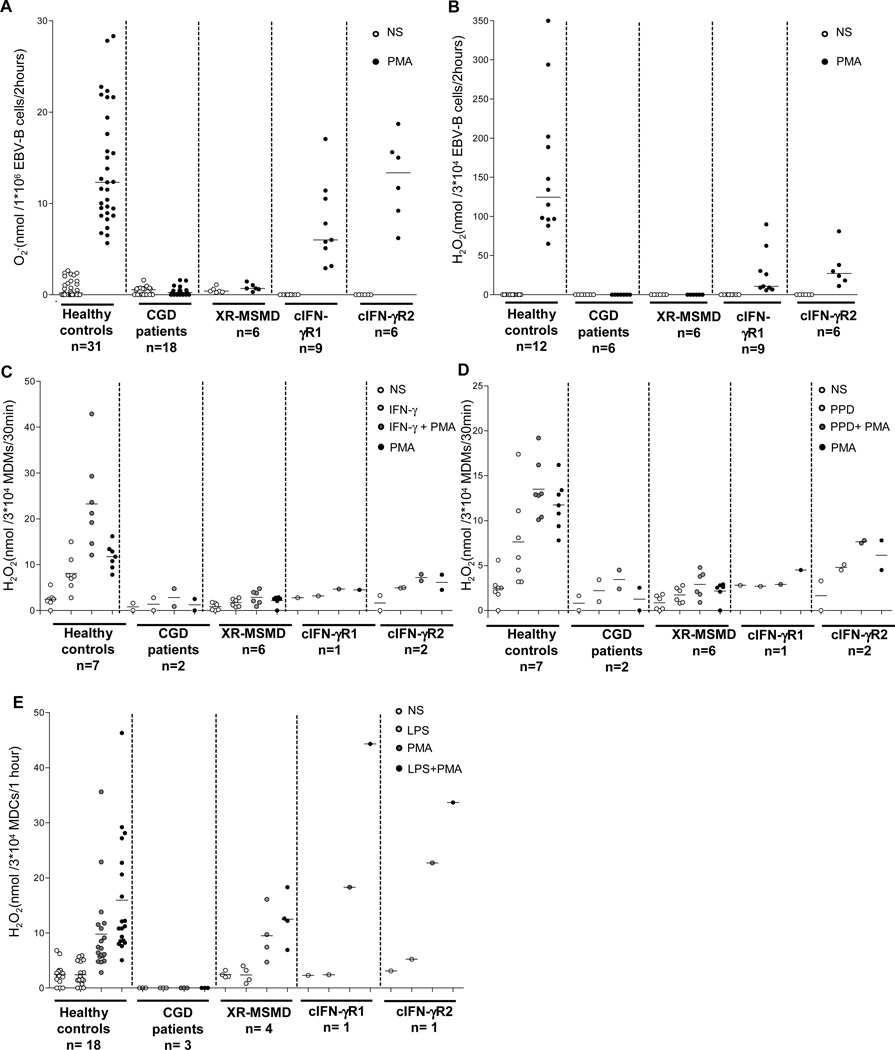
Figure 1. NADPH oxidase activity in human EBV-B cells, MDDCs and MDMs.
A. O2- generation of EBV-B cells from healthy controls (n=31), CGD patients (n=18), XR-MSMD (n=6) and IFN-γR1/IFN-γR2 complete (c) deficiencies (n=9 and 6 respectively), measured by cytochrome-c reduction test after 2 h PMA (400 ng/ml) activation. Each symbol represents an individual subject. B. Fluorimetric quatification of H2O2 release from EBV-B cells of healthy controls (n=12), CGD (n=6), XR-MSMD (n=6) and cIFN-γR1/cIFN-γR2 (n=9 and 6 respectively), measured by Amplex Red® assay after 2 h PMA (400 ng/ml) activation. C and D. Fluorimetric quatification of H2O2 release after 30 min from MDMs of healthy controls (n=7), CGD (n=2) and cIFN-γR1/cIFN-γR2 (n=1 and 2 respectively), measured by Amplex Red® assay then left untreated (NS) or treated for 18 h with IFN-γ (1×10⁵ IU/ml), PPD (1 mg/ml), followed by no trigger or by treatment with PMA (400 ng/ml) activation. E. Release of H2O2 from MDDCs obtained from healthy controls (n=18), CGD (n=3), cIFN-γR1/cIFN-γR2 (n=1 and 1 respectively) and X-MSMD (n=4) deficiency, then left untreated (NS) or treated with LPS, followed by no trigger or by treatment with PMA (400 ng/ml). Each symbol represents an individual subject. Data are representative of two experiments. (A, B; mean of duplicates) and mean of duplicates (C, D, E).

