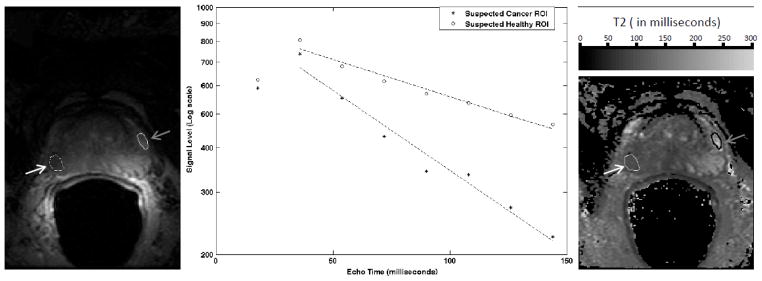
Figure 3.

T2 mapping analysis. (a) A single slice image from the IV-CPMG acquisition of one patient. The image is for the fourth echo (TE = milliseconds). ROIs for regions in the peripheral zone of suspected cancer (white arrow) and suspected healthy (gray arrow) are overlaid. (b) The signal values and fits for all 8 echoes are shown for the suspected cancer (‘*’) and suspected healthy (‘o’) regions. The data from the first echo was not used when fitting data to estimate T2 (see text for discussion). The mean T2’s for the ROIs are 96 (cancer) and 208 milliseconds (healthy). (c) The T2 map estimated from the IV-CPMG data is displayed along with the ROIs.
