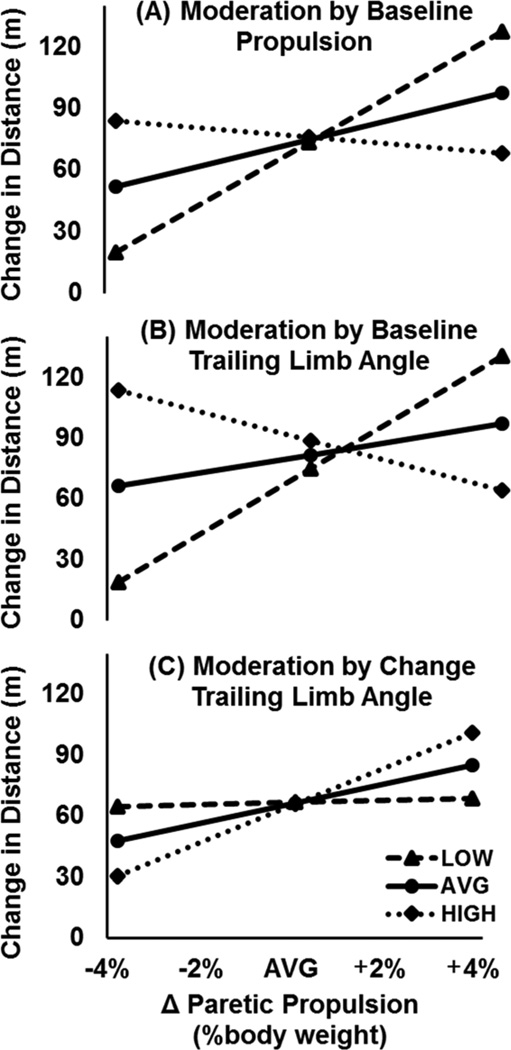
Figure 2.
Moderated regression plots present a visual representation of the relationship between changes in paretic propulsion (x-axis) versus changes in long-distance walking function (y-axis) as moderated by pretraining propulsion (panel A), pretraining trailing limb angle (panel B), and changes in trailing limb angle (panel C). This relationship was strongest in those with LOW (ie, 1 standard deviation below the mean) pretraining levels of propulsion (< 3.67% body weight, panel A) and trailing limb angle (< 7.2 degrees, panel B). Moreover, changes in paretic propulsion most strongly related to changes in long-distance walking function in those with the largest change in trailing limb angle (ie, 1 standard deviation above the mean: > 7.41 degrees) (panel C). Please note that panels A-C present simple slopes at each level of the moderator, not a grouping of subjects.

