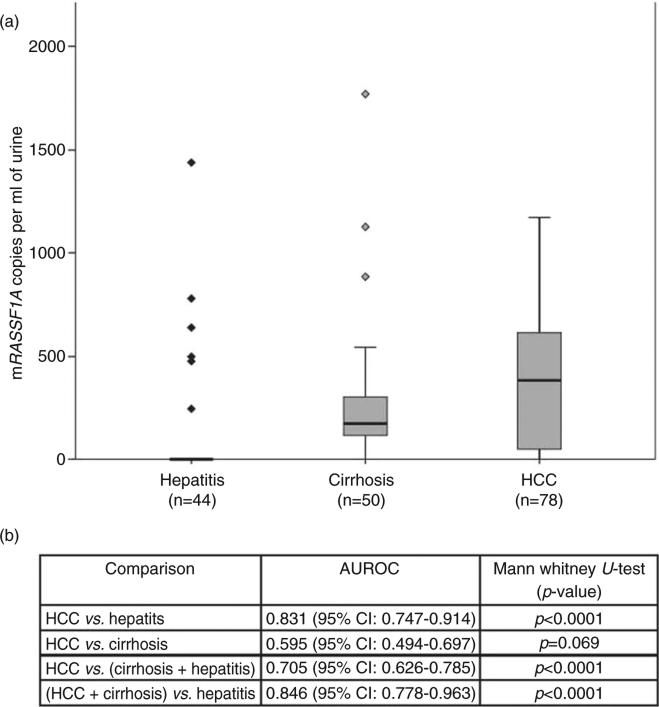
Figure 4.
Analysis of methylated RASSF1A in the urine of patients with hepatitis, cirrhosis and hepatocellular carcinoma (HCC). (a) Box plot showing the distribution of mRASSF1A copies in the urine of patients with hepatitis, cirrhosis and HCC. The median value is indicated by a line within each box and the diamond symbols (◇,  ) indicate outliers in the respective group. (b) Performance of mRASSF1A in urine as a biomarker for severe liver diseases. Area under the receiver–operator curve values for mRASSF1A in urine as a marker to discriminate severe liver diseases, HCC and cirrhosis from hepatitis and P-values of each comparison by Mann– Whitney U-test are listed in the inserted table.

