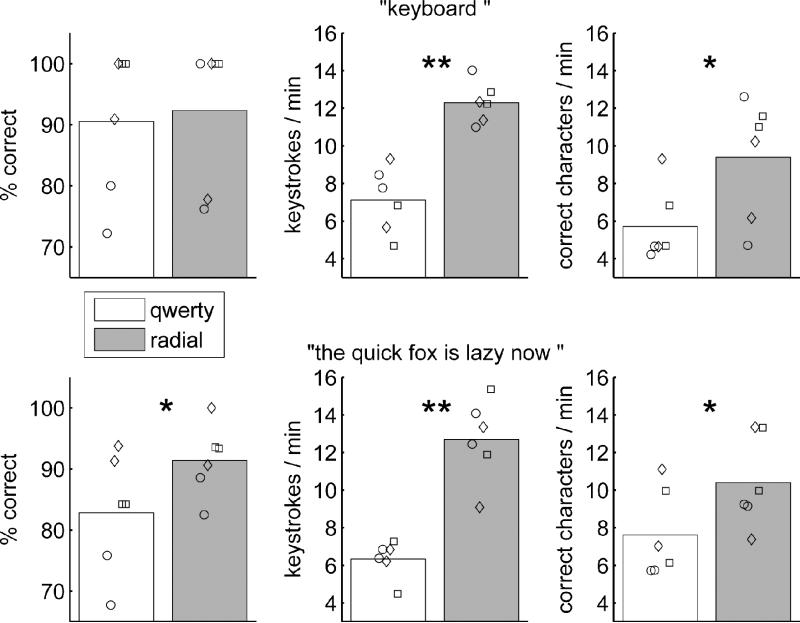
Figure 3.
Pooled performance results from the copy-spelling tasks. Top Row: performance in the “keyboard” task. Bottom Row: performance in the “quick fox” task. Left column: percent correct (accuracy). Middle column: keystrokes per minute. Right column: correct characters per minute. Bars = mean performance across the 6 blocks from all 3 sessions. Data points show individual block performance for the 6 repetitions of typing each phrase for each task across the 3 sessions. Data points are offset horizontally, representing the temporal order of their occurrence (left to right; circles, diamonds, and squares correspond to trial days 1895, 1918, and 1925, respectively). * = p < 0.05, ** = p < 0.0001 (one-tailed paired t-test).

