
FIG. 6.
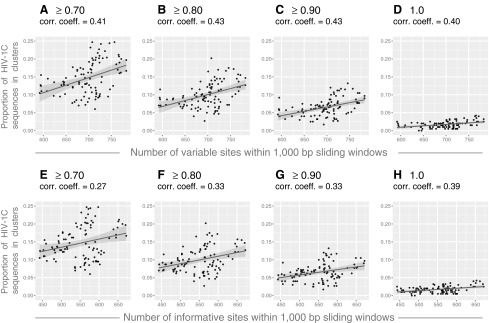
The number of variable and informative sites and HIV clustering. Results of correlation analysis between the extent of HIV clustering and the number of variable and informative sites are presented. Axis y shows the proportion of HIV-1C sequences in clusters. (A–D) Axis x shows the number of variable sites within 1,000-bp sliding windows across the HIV-1C genome. Graphs show the extent of HIV clustering at different bootstrap thresholds for cluster identification: (A) ≥0.70, (B) ≥0.80, (C) ≥0.90, and (D)=1.0. (E–H) Axis x shows the number of informative sites within 1,000-bp sliding windows across the HIV-1C genome. Graphs show the extent of HIV clustering at different bootstrap thresholds for cluster identification: (E) ≥0.70, (F) ≥0.80, (G) ≥0.90, and (H)=1.0.