
FIG. 6.
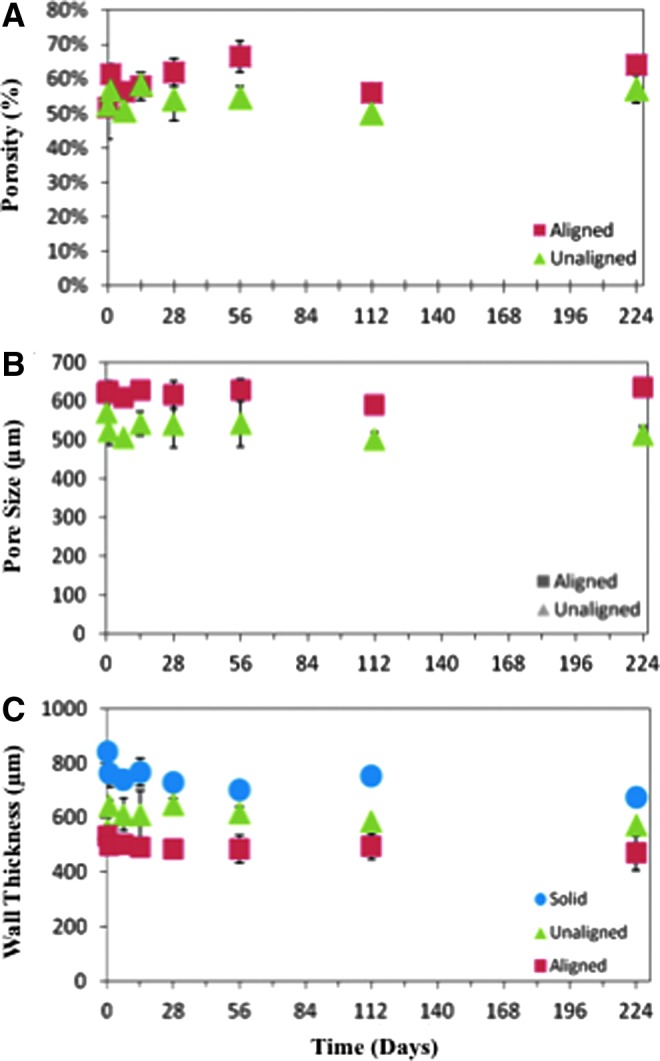
Scaffold pore changes during degradation. μCT was used to calculate the porosity, pore size, and wall thickness of the scaffolds during the degradation study. Porosity (A) is seen to increase slightly from days 0 to 224, while mean pore size remains constant (B). Similarly, there is no statistical difference in wall thickness for the aligned or unaligned scaffolds. The solid wall scaffolds (C) wall thickness decreases over the study, with a statistically larger wall thickness on day 0 compared with all other timepoints. The mean and standard deviation are reported, and some standard deviations are too small for the error bars to appear (n=3). *Denotes p<0.05 from all other timepoints within the same group for the solid wall scaffolds.