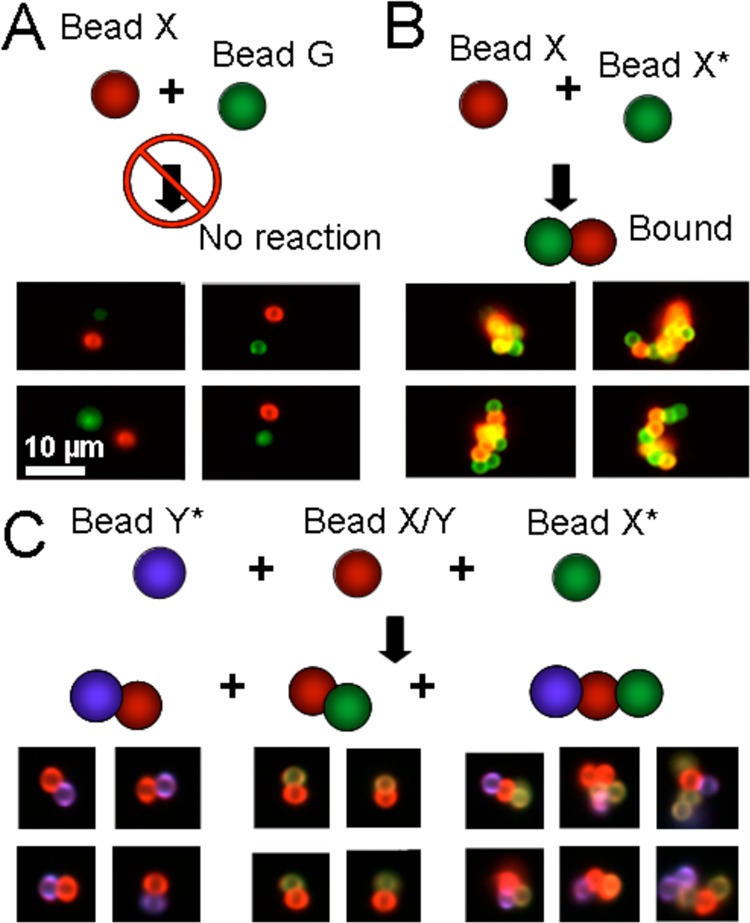
Figure 1.

Imaging cytometry of hybridized microparticles. (A) Representative images from imaging flow cytometry show that mixing microparticles bearing noncomplementary DNA yields dispersed, single microparticles. Scale bar is 10 μm throughout. (B) Representative images show self-assembled clusters of microparticles bearing complementary DNA (green X and red X). (C) Schematic shows beads bearing orthogonal specificities; representative images show the specific microparticle clusters.
