Figure 9.

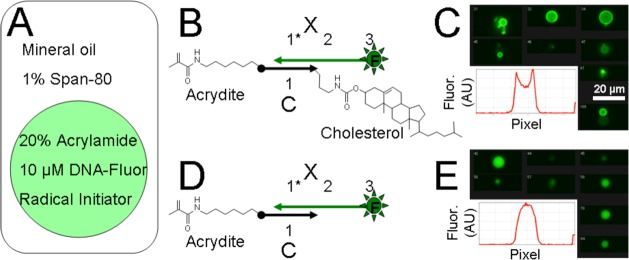
Hydrogel-based microparticle generation. (A) Schematic shows how acrylamide- and acrydite-modified DNA was encapsulated within microbubbles within a water/oil dispersion and then polymerized. (B) Schematic of the cholesterol-modified DNA complex with acrydite and fluorophore. (C) Imaging cytometry data showing the distribution of fluorescent DNA to the outer edge of the final microparticle. Scale bar is 20 μm. The inset shows the line intensity profile of fluorescence from a representative image. (D) Schematic of the noncholesterol-modified DNA complex that was polymerized within control emulsion bubbles. (E) Imaging cytometry data showing the distribution of fluorescent DNA throughout the particle. Scale is the same as E. The inset shows the line intensity profile of fluorescence from a representative image.
