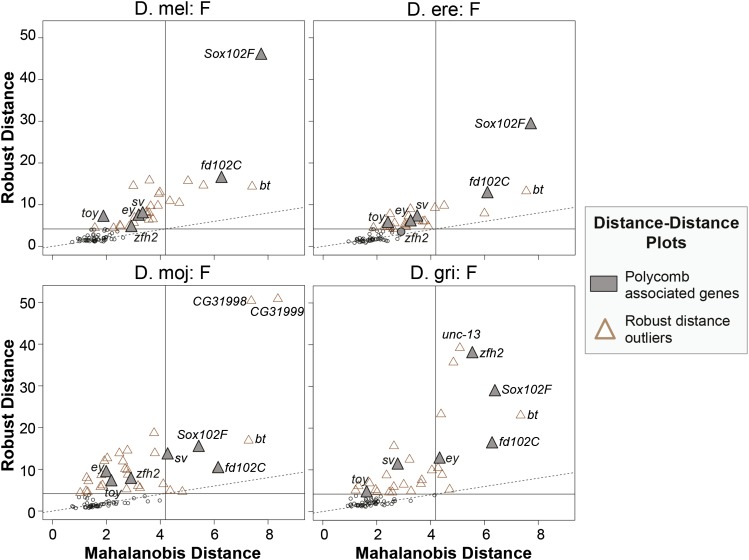
Figure 7.
Distance–Distance Plots of robust distance (RD) vs. Mahalanobis distance (MD) show both common and species-specific outliers. The horizontal and vertical lines correspond to the cutoff values for outliers (97.5% quantile of the χ2 distribution, see File S1). Values greater than the cutoff values identify outliers. Triangles in the upper right quadrant are outliers based on both RD and MD. Triangles in the upper left quadrant are outliers only based on RD. The dashed line corresponds to points with equal RD and MD values. F element genes that reside in a Polycomb domain in D. melanogaster are highlighted in gray.

