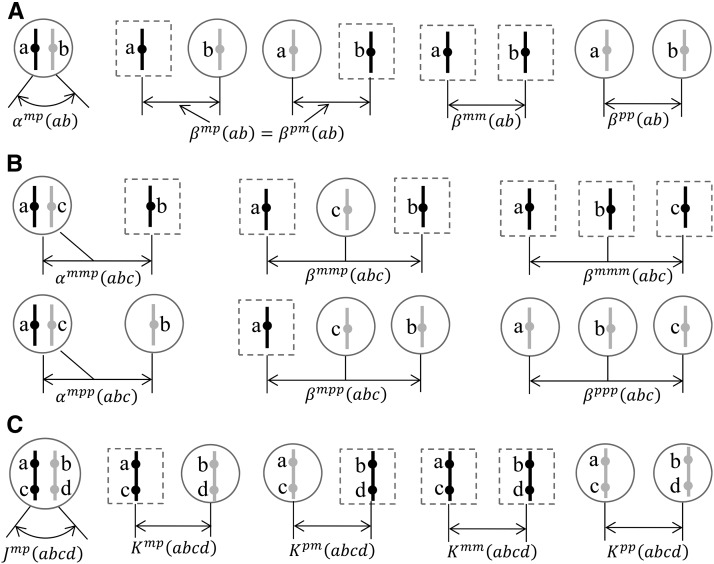
Figure 2.
Schematics of (A) the probabilities of the two-gene IBD configurations, (B) the probabilities of the three-gene IBD configurations, and (C) the expected junction densities. Circles denote females, and dashed rectangles for males or females. Black vertical lines denote the maternally derived X chromosomes, and gray vertical lines for the paternally derived. Dots denote genes on chromosomes.

