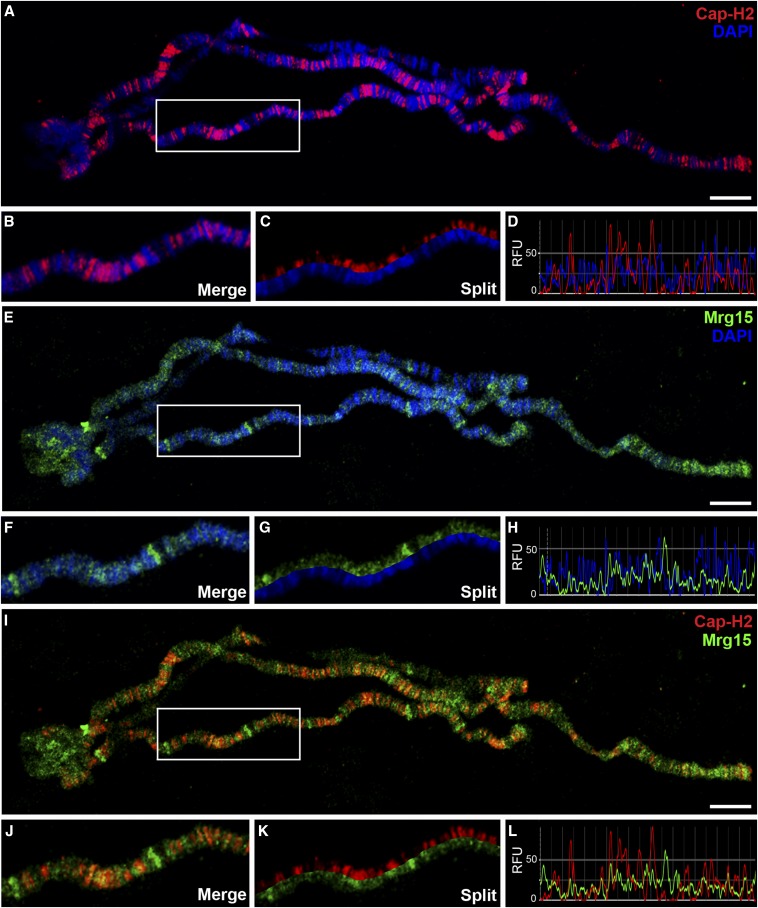
Figure 1.
Cap-H2 co-localizes with Mrg15 at interbands of salivary gland polytene chromosomes. (A, E, I) Salivary gland polytene chromosomes from wild-type larvae stained for Cap-H2 (red), Mrg15 (green), and DNA (blue) as indicated. Scale bar, 10 μm. Enlarged merged (B) and split (C) image of boxed area in (A) showing Cap-H2 staining at interband regions. (D) Fluorescence intensity plots of image in (B) showing Cap-H2 and DAPI peaks do not overlap. Enlarged merged (F) and split (G) image of boxed area in (E) showing Mrg15 staining at interband regions. (H) Intensity plots of image in (F) showing Mrg15 and DAPI peaks do not overlap. Enlarged merged (J) and split (K) image of boxed area in I showing co-localization of Cap-H2 and Mrg15. (L) Fluorescence intensity plots of image in (J) showing frequent overlap of Mrg15 and Cap-H2 peaks. RFU, relative fluorescence units.

