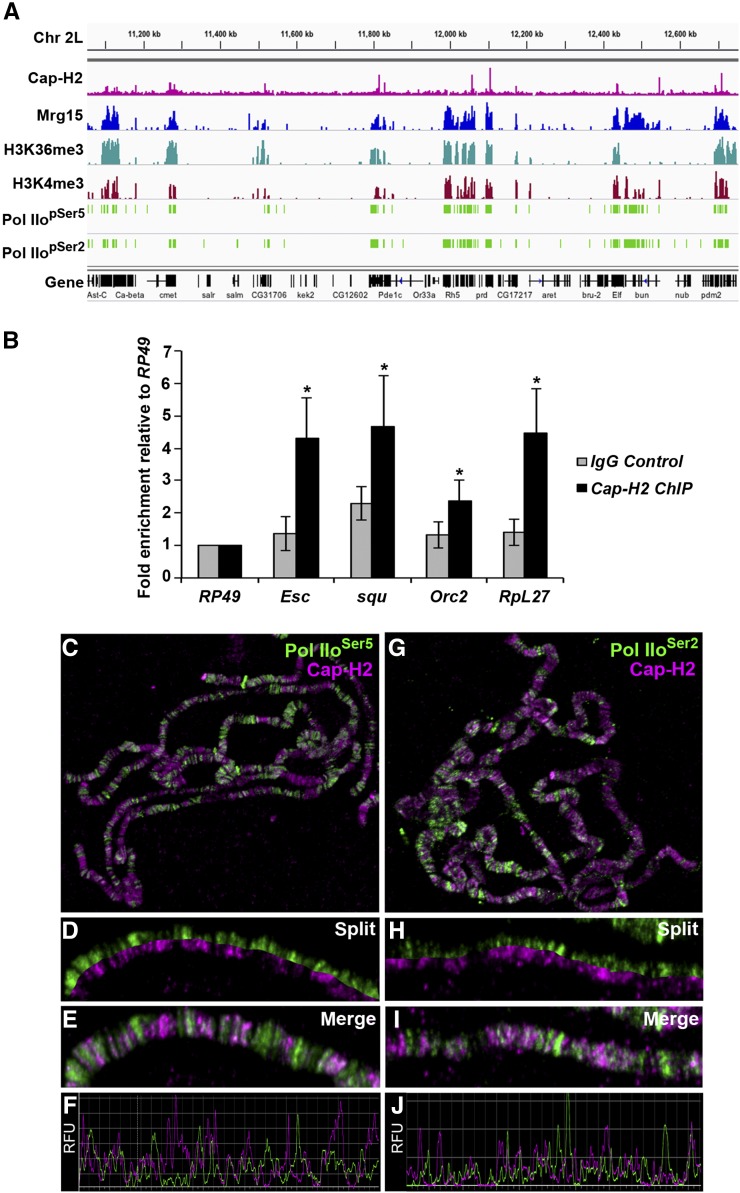
Figure 2.
Cap-H2 binding overlaps with Mrg15 at transcriptionally active regions. (A) Representative Integrated Genome Viewer (IGV) screenshot of ChIP-seq binding profiles for Cap-H2, Mrg15, H3K36me3, H3K4me3, PolII pSer5, and PolII pSer2 across a region of chromosome 2L. (B) ChIP-qPCR validation of a subset of Cap-H2 ChIP-seq peaks using anti-Cap-H2 or IgG as negative control. IGV screenshot of corresponding ChIP-seq peaks are shown in Figure S5. Results are expressed as mean fold enrichment relative to control (RpL49) ± SEM of four biological replicates. *P < 0.05, Mann-Whitney rank sum test. (C–E and G–I) Salivary gland polytene chromosomes from wild-type larvae stained for Cap-H2 (red) and Pol IIoSer5 or Pol IIoSer2 (green) as indicated. (C, G) Enlarged split (D, H) and merged (E, I) images show overlap between Cap-H2 and Pol II staining. (F, J) Fluorescence intensity plots of images in E and I. RFU, relative fluorescence units.

