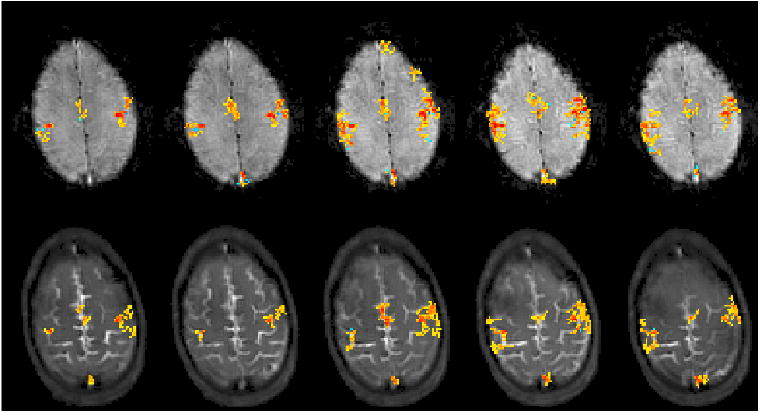
Figure 3.

Repeated motor cortex imaging using STFR and BOLD in one subject (A, Session 1). (a) Activation maps with correlation threshold 0.3 and cluster size 10 (28). All five scans demonstrate that STFR can produce similar activation maps as BOLD, which are well localized to the motor cortex area. (b) ROI used to calculate the mean time course for each sequence, obtained by selecting the pixels showing activations in at least 4 scans in both BOLD and STFR. (c,d) One cycle of the mean time course signal over the ROI, shown as absolute (c) and relative (d) changes. In (c) the signal level is scaled by the corresponding background noise, and in (d) the rest state signal is normalized to be 1. STFR has slightly lower relative signal change than BOLD, but higher absolute signal change (i.e., higher CNR), as predicted in simulation. The calculated functional signal change is reported in Table 2.
