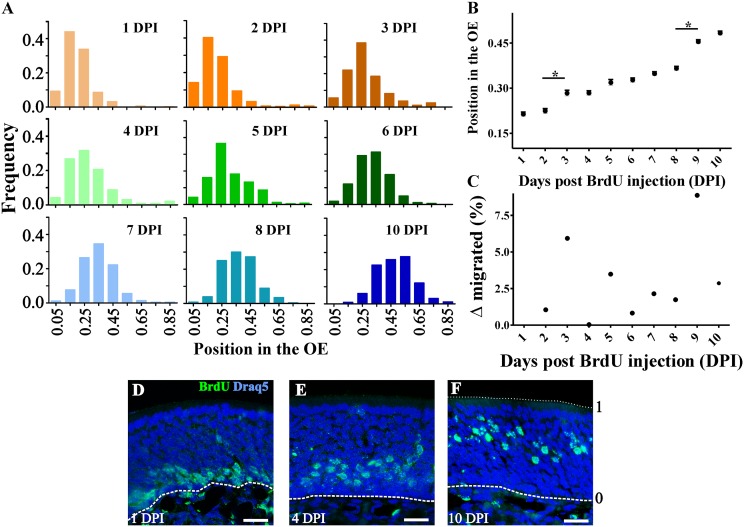
Fig. 1.
OSNs migrate radially in the OE. (A) Histogram distributions showing BrdU+ cells relative frequency in the OE. The basal lamina is considered as 0 and the surface of the OE as 1 (shown in F). Relative position of BrdU+ cells expressed as mean ± SEM (B; *P < 0.001) and migrated distance (C). (D–F) Representative images of BrdU+ (green) labeling at 1 (D), 4 (E), and 10 (F) DPI. Nuclear marker Draq-5 is shown in blue. Dotted and dashed lines delineate the surface and the basal lamina of the OE, respectively. (Scale bars, 20 μm.)

