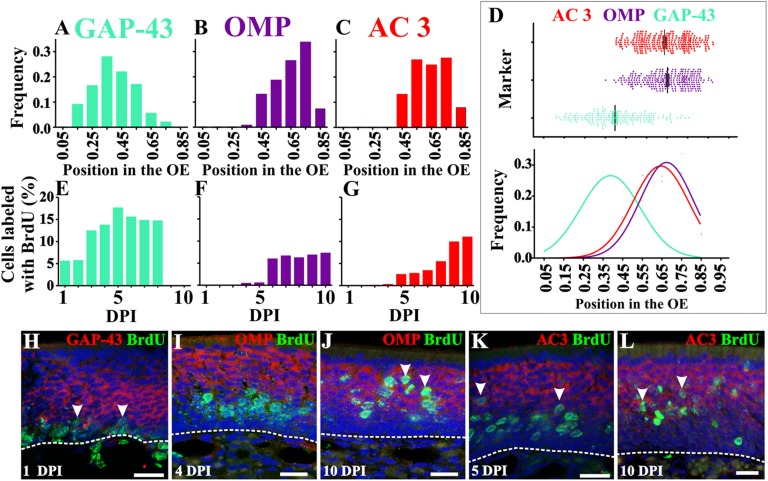
Fig. 2.
Timeline of GAP-43, OMP, and AC3 expression. Distribution of GAP-43+ (A), OMP+ (B), and AC3+ (C) OSNs in the OE. (D) Scatter plot for GAP-43, OMP, and AC3 showing their relative position in the OE (Top) and normal distributions associated with histograms (Bottom). Although largely restricted to the lower lamina of the OE, GAP-43 cell bodies exhibit a wider distribution than OMP or AC3. Quantification of cells double-labeled with BrdU and GAP-43 (E), OMP (F), or AC3 (G). Although some OMP+ and AC3+ cells were also BrdU+ at earlier days, these were very few (<0.05%) and inconsistent across subjects. (H–L) BrdU+ staining in green and in situ hybridization in red for GAP-43 (H), OMP (I and J), and AC3 (K and L). Arrowheads indicate double-labeled cells. Dashed lines delineate OE basal lamina. Draq-5 is in blue. (Scale bars, 20 μm.)

