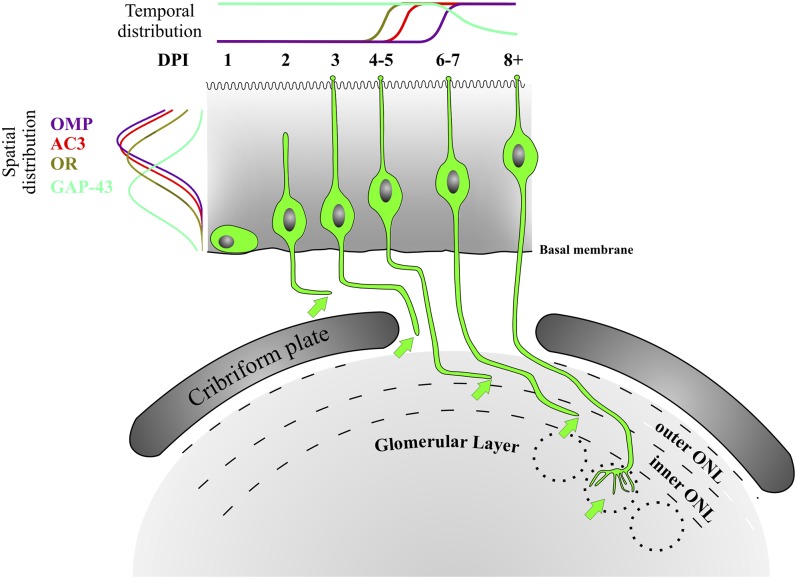
Fig. 6.
OSN differentiation with spatial-temporal gene profiles. The spatial distribution of OSN cell bodies expressing GAP-43 (cyan), ORs (light green), AC3 (red), and OMP (purple) within the olfactory epithelium is on the left. The temporal expression profile of these genes is at the top. The morphology of olfactory sensory neurons, in green, is correlated with the corresponding DPI. Arrows indicate the ending of the axon at each developmental stage. Dashed lines demarcate edges of the inner and outer ONL. Dotted circles represent glomeruli.

