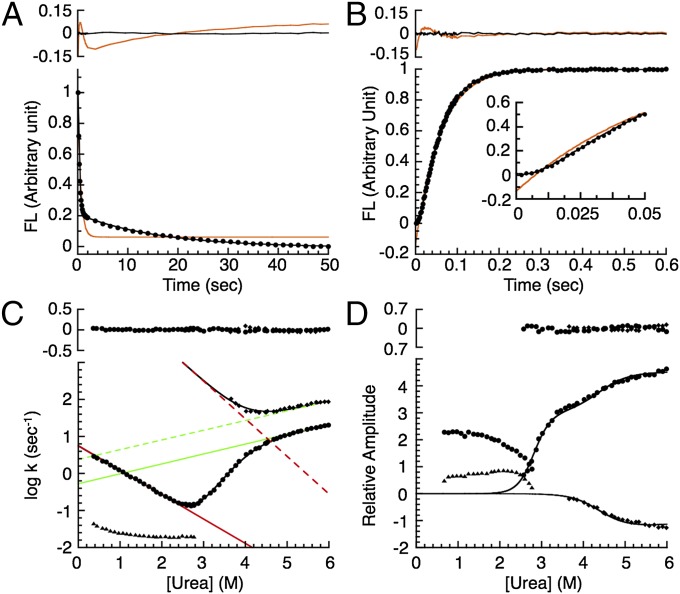
Fig. 3.
Refolding and unfolding kinetics of PP32. (A) Fluorescence-detected refolding (circles) from 4.6 to 0.42 M urea and (B) unfolding to 6 M urea. Red and black lines show single- and double-exponential fits, respectively. (Upper) Residuals. (C) Urea dependence of rate constants and (D) associated amplitudes for folding. Circles, major refolding and unfolding phases; triangles, minor refolding phase; diamonds, minor unfolding phase. The black lines result from fitting of (C) rate constants (excluding the minor proline-limited refolding phase) and (D) unfolding amplitudes using a sequential three-state model (Experimental Procedures). Straight lines in C show fitted folding (red) and unfolding (green) rate constants for conversion between D and I (continuous) and between I and N (dashed). (C and D, Upper) Residuals from the three-state model.

