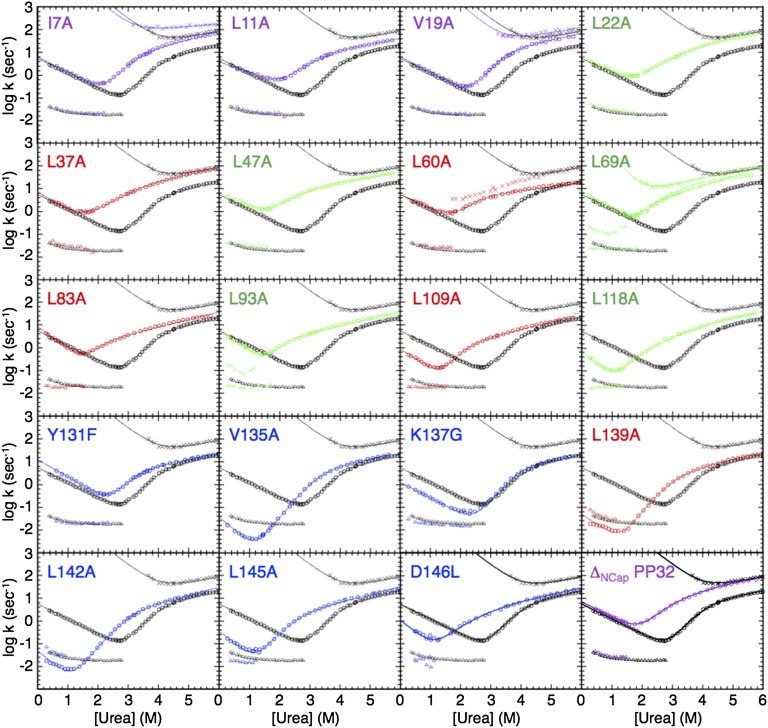
Fig. 4.
Chevron plots for variants of PP32. Urea dependence of fluorescence-monitored rate constants for the major refolding and unfolding phases (circles), the minor refolding phase (triangles), and the minor unfolding phase (diamonds) of WT PP32 (black chevron in each panel), and variants (colors are as in Fig. 4). Lines result from fitting a sequential three-state kinetic model to the data.

