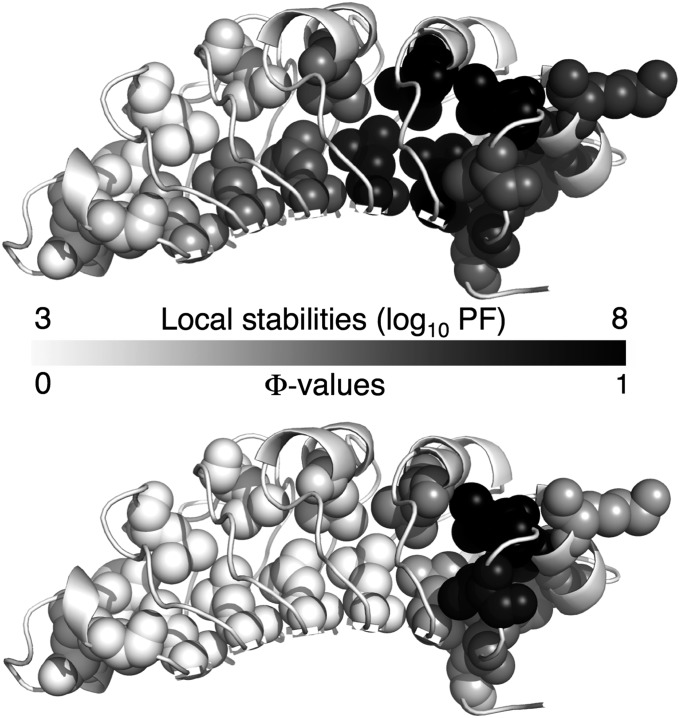
Fig. 7.
Folding pathway of PP32. Ribbon representation, with Φ-value substitutions shown as spheres. Residues are shaded from white to black, with black having the highest local stability (Upper) and Φ-value (Lower). For direct comparison, only sites with both Φ-value and local stability data are shaded. Based on the coincidence of high protection factors and Φ-values, folding is initiated at the most stable region of PP32.

