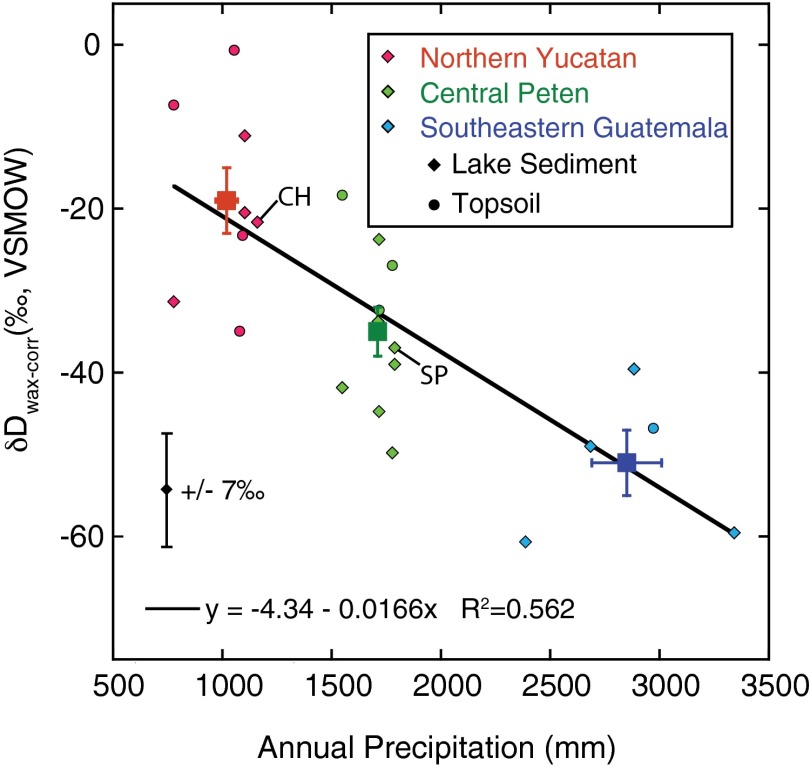
Fig. 2.
Scatter plot showing the negative relationship between annual precipitation and δDwax-corr measured in modern lake sediment and soil samples (Fig. 1). Results from Lake Chichancanab (CH) and Salpeten (SP) are indicated. The black line indicates a linear regression fit to these data, with regression statistics reported at the bottom of the plot. Large squares indicate mean values for each sampling region, with error bars indicating SEM in both δDwax-corr and annual precipitation. The black error bar indicates the 1σ error for δDwax-corr values (SI Text). Original δDwax data from ref. 17. VSMOW, Vienna Standard Mean Ocean Water.

