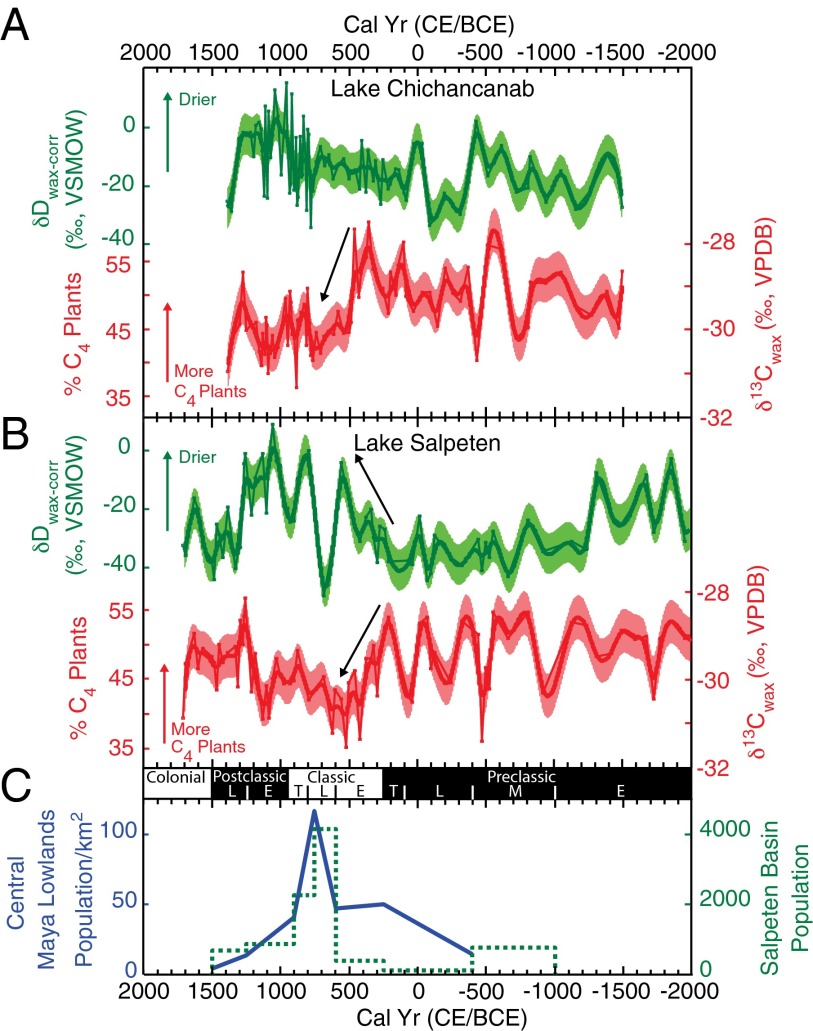
Fig. 6.
Coupled plant wax isotope records of hydroclimate and land use change from (A) Lake Chichancanab and (B) Lake Salpeten, alongside (C) estimates of population in the Lake Salpeten catchment (56) and population density in the central portion of the southern Maya Lowlands (57). The δDwax-corr and δ13Cwax records in A and B are fit to a smoothing spline (thicker lines) to highlight centennial-scale trends. Colored envelopes indicate 1σ error applied to the smoothing spline fits for δDwax-corr (±7‰) and δ13Cwax (±0.5‰). Estimates of percent C4 plants are discussed in SI Text.

