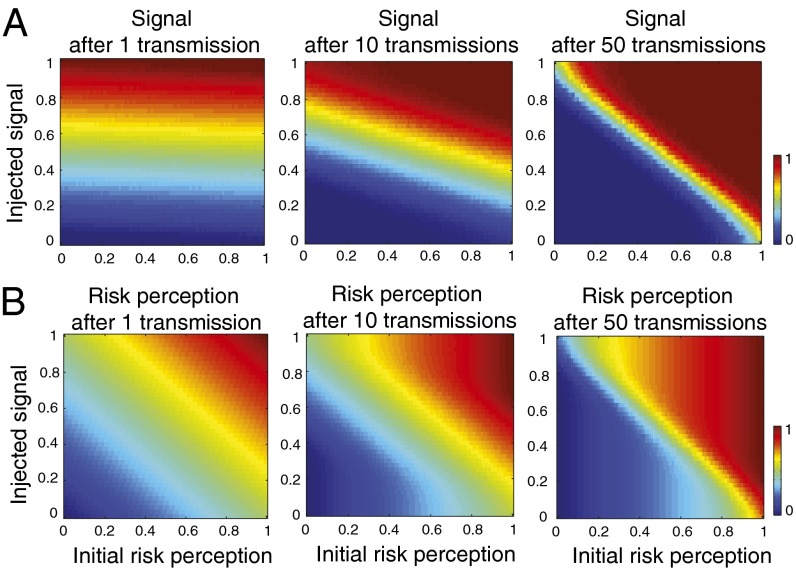
Fig. 5.
Computer simulations. (A) Evolution of the risk signal at chain positions 1, 10, and 50 as a function of the initial risk perception of the individuals (x axes) and the signal of the injected message (y axes). The gradual dominance of extreme values (in dark red and dark blue) demonstrates the amplification of the risk signal. (B) Evolution of individuals’ risk perception follows a similar trend. Individuals who initially expressed extreme risk perception (x = 0 or x = 1) gradually move back to their initial view, regardless of the message signal. The social influence parameter is set to s = 0.5. Simulations varying the value of s are provided in Fig. S4. Results are averaged over 500 simulations.

