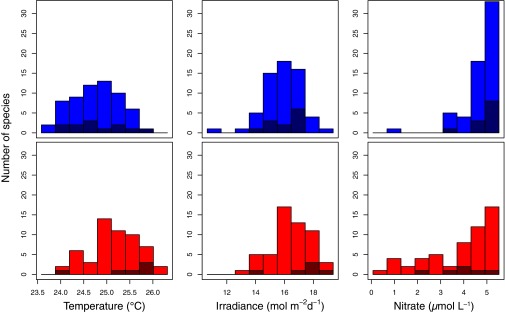
Fig. 2.

The change in the distribution of mean niches in response to warming for species before and after January 1, 2004, in the CARIACO Ocean Time-Series in pairs of panels: temperature, irradiance, and nitrate concentration. (Top) Mean niche before January 1, 2004, with species only observed in this early, cool period shown in dark blue. (Bottom) Mean niche after January 1, 2004, with species only observed in this later, warm period shown in dark red.
