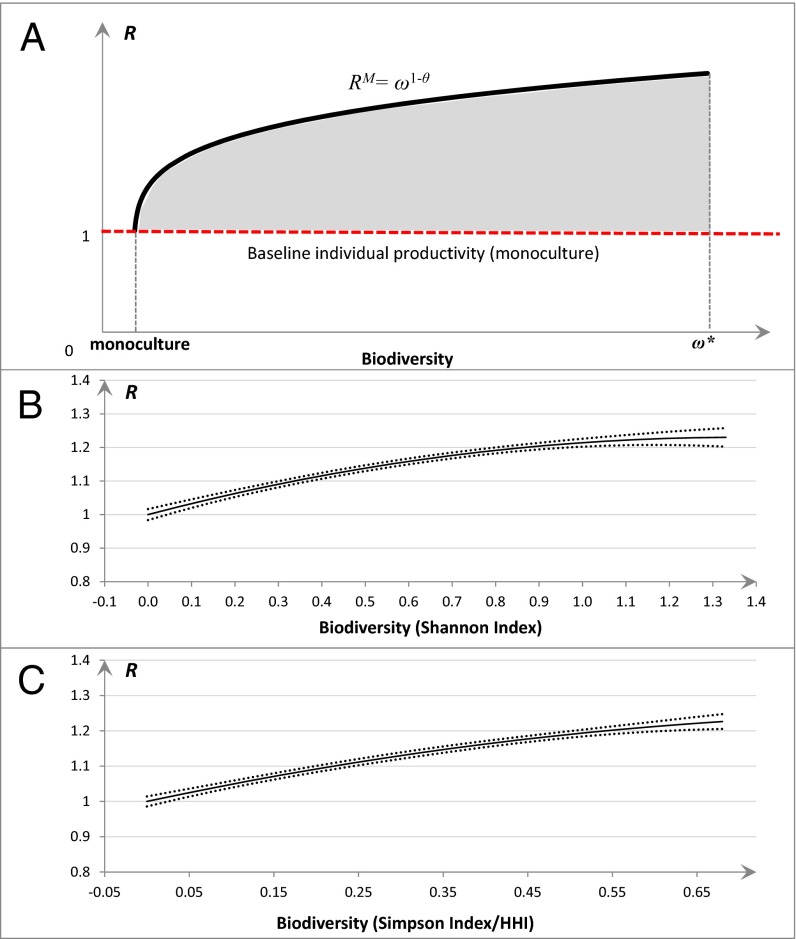
Fig. 2.
Theoretical biodiversity–productivity relationship based on the niche–efficiency model (A) and empirical evidence drawn from the Alaska boreal forest (B and C). (A) The solid curve (black) represents the optimal relative productivity (RM = ω1 − θ) that can only be reached theoretically with an even distribution of biomass by species and a constant substitutability for all of the species, θ. The shaded area represents the feasible region of R that falls between the optimal individual productivity and the baseline individual productivity value of 1 (red broken line). ω* represents the highest possible degree of diversity. For empirical evidence, estimated mean (solid) R value against biodiversity in Shannon index (B) and in Simpson index/HHI (C) and associated 95% confidence interval bands (dots) are obtained using bootstrapping from the GLS model which controls for spatial and temporal autocorrelation and other exogenous factors (SI Appendix, Table S2).

